
Every month, a meaningful chunk of the typical Canadian household budget disappears into wireless plans, home Internet, perhaps a television package nobody watches properly, and increasingly a second or third mobile line for the family. For this article, I am going to use C$250 a month, or C$3,000 a year, as a simple hypothetical household telecom bill. It is an illustration, not an estimate of the current national average.
The investor’s version of grievance is obvious. If I am going to keep sending these companies thousands of dollars a year, perhaps I should own enough of them to get some of it back. Call it the moral hedge. A Bell price increase shows up on my statement, and a Bell dividend shows up in my brokerage account, and the two feel faintly related even though they have nothing to do with each other. It is a good hook and I intend to use it, but resentment toward a monthly bill is not an investment thesis. The only question that matters is whether BCE, TELUS, Rogers, Quebecor or Cogeco offers enough value, sustainable cash flow and long-term growth to deserve a place in my portfolio as an individual stock, rather than as the small slice of each that my index funds already hold.
I started this research expecting that one of them probably would. Canadian telecom has a long reputation as a defensive, income-producing corner of the market, and several of these stocks have fallen hard enough over the past two years that a bargain seemed plausible. The answer that came out of the work was more interesting than that, and a little less comfortable. There are investable businesses in this group. There are also, in my judgement, no purchases at today’s prices that justify swapping diversified fund money for a concentrated, leveraged bet on a company I already own indirectly. How I got there matters more than where I ended up, so I will take it in order.
Why Canadian telecom used to look easy
The old case was never complicated. A wireless or Internet subscriber pays every month, and switching carriers is annoying enough that most people don’t. Spectrum licences cost billions, networks cost billions more to build and replace, and the rural, low-density geography that makes Canadian networks expensive also discourages entrants. For most of the past two decades the Big Three carriers (and Bell’s and TELUS’s regional wireline franchises, and Rogers’ and Shaw’s cable systems) enjoyed a market in which a new competitor needed almost unlimited capital and patience. Revenue was recurring and demand was predictable. Companies that sell something people will not give up, to customers who rarely leave, should be able to distribute most of their cash flow, and for years that is exactly what BCE and TELUS did. Both raised their dividends almost every year. BCE’s annualized dividend went from about C$3.17 in 2019 to C$3.99 in 2024, roughly 5% a year, and TELUS, adjusting for its stock splits, grew its payout at something like 6% to 7% a year over the decade ending in 2025, backed by a formal dividend-growth program it first announced in 2011.
Canadian investors came to treat that record as close to a bond coupon with a growth feature. The comparison with a utility seemed natural: regulated or quasi-regulated, capital-intensive, cash-generative, dull. It also contained a hidden error. A utility’s rate base and allowed return are set by a regulator, which makes its cash flow much more predictable than a competitive telecom’s. A telecom carries comparable capital intensity and comparable debt, but it also faces technology cycles that force periodic rebuilds, a government that has made lower consumer prices an explicit policy goal, and competitors, Quebecor most visibly, with every incentive to take customers with lower prices. Telecom has utility-like revenue and none of a utility’s protection. The traditional proposition was that stable cash flow supported a growing dividend. What 2025 and 2026 demonstrated is that the dividend can keep growing after the cash flow stops supporting it.
The dividend promise broke
In May 2025 BCE cut its annual dividend from C$3.99 to C$1.75 a share, a reduction of about 56%. On July 31, 2026 TELUS reset its quarterly dividend from C$0.4184 to C$0.1875, taking the annualized payout from about C$1.67 to C$0.75, a cut of about 55%. TELUS had raised its dividend in November 2025 and paused further increases in early December before cutting it eight months later. Rogers, the third incumbent, has paid C$2.00 a year since January 2019. In nominal terms that is a dividend going nowhere. In real terms it has lost roughly a fifth of its purchasing power, and for most of that period it looked like the weakest of the three.
The lesson is not that dividend growth is bad. It is that a dividend that does not grow can be safer than a growth streak the business cannot afford. The warning signs at BCE and TELUS were visible years before the cuts. BCE’s own filings said its payout would stay above its stated 65% to 75% target of free cash flow in 2024, and my arithmetic puts 2024 common dividends at something like 125% to 130% of the free cash flow it reported, while leverage rose from about 3.5 times to about 3.8 times in a single year, the company introduced a discounted dividend reinvestment plan, and its credit rating came under pressure. TELUS told investors its 2026 dividend declarations would total about C$2.6 billion at the old rate, against free cash flow it had guided to roughly C$2.2 billion for 2025. About a third of its January 2026 dividend was paid in newly issued shares through its reinvestment plan, which is a polite way of saying part of the dividend was being financed by selling stock back to the shareholders receiving it.
I want to avoid overstating causation, because it is tempting to tell this story as a morality tale about dividend growth. When I tested the idea, the incremental increases turned out to be a modest part of the damage. Had BCE frozen its dividend at the 2019 level instead of raising it each year, its leverage by the end of 2024 would have been lower by roughly two-tenths of a turn of EBITDA, and the comparable figure for TELUS over a shorter window was about one-tenth. Those are my calculations from the dividend history and reported EBITDA, and they ignore acquisitions, asset sales and share issuance, so they understate the full picture. The larger problem was the level of the payout relative to cash generation, combined with heavy capital spending and acquisitions, and an unwillingness to adjust the distribution while those things were moving in the wrong direction. A dividend cheque is capital allocation. When a company pays out more than its free cash flow, the difference comes from debt or from new shares, and the investor receiving the cheque is partly being paid with his own money.
What “free cash flow” means depends on who is saying it
Most of the argument for owning telecom stocks rests on free cash flow yield, so it is worth knowing what each company means by the term, because they do not mean the same thing. This was the most useful thing I learned in the research. TELUS defines free cash flow after deducting lease principal and the cash cost of restructuring, and it excludes working-capital swings, which makes its number the most conservative of the large incumbents. BCE reports free cash flow before lease principal, and publishes a separate “free cash flow after payment of lease liabilities” measure that is the more useful one for this comparison. Rogers’ published free cash flow is adjusted EBITDA less capital expenditures, interest on borrowings and cash taxes, which leaves out lease payments, restructuring and acquisition costs, and working capital. Quebecor’s reported figure starts from operating cash flow and therefore includes working-capital movements, which flattered 2025 considerably. Cogeco’s definition is structurally conservative, since it deducts lease repayments, restructuring and cash interest, but the consolidated figure still requires care because a Quebec pension investor owns 21% of its U.S. cable business and current cash taxes have been unusually low.
| Company | Lease principal deducted? | Restructuring deducted? | Working capital | Main complication |
|---|---|---|---|---|
| TELUS | Yes | Yes | Excluded | 2026 includes elevated restructuring cash |
| BCE | No (separate after-lease measure) | In operating cash flow; acquisition costs added back | Included | Lease principal is about C$1.1B a year |
| Rogers | No | No | Excluded | Capital spending at a multi-year low |
| Quebecor | No (small) | Yes | Included | 2025 growth mostly working capital |
| Cogeco | Yes | Yes | Excluded | Minority interest not deducted; low cash taxes |
None of these companies is misrepresenting anything. Each discloses its definition, and the reconciliations are in the filings. The problem is that a reader comparing a 14% “free cash flow yield” at one company with 10% at another is comparing different things. For this article I adjusted each company to a rough owner-cash-flow measure, meaning cash left for common shareholders after capital spending, interest, taxes and leases. Rogers is the least precise standardization because its disclosures do not allow every adjustment to be isolated cleanly, particularly lease-related and restructuring cash costs. Rather than treating the resulting figure as an audited alternative measure, I use a range and test Rogers across different capital-spending assumptions. The direction is more important than the exact adjustment: Rogers’ reported free cash flow is not directly comparable with TELUS’s more conservative definition. The first rule I took away is that no telecom free cash flow yield should be compared with another until I have checked what each company counts.
The competition politicians asked for
A short digression on the industry itself, because it affects every valuation below. The CRTC’s 2026 Canadian Telecommunications Market Report says Canada’s three largest mobile operators continued to account for about 90% of the national market in 2024, while competitors were responsible for more than 55% of the mobile subscribers added during the year. Mobile service prices have fallen sharply from their 2021 levels, revenue per user declined again in 2024, and wireless earnings have been roughly flat since 2022. The mechanism is the one Ottawa wanted. When Rogers bought Shaw, Quebecor acquired Freedom Mobile for C$2.85 billion, and the undertakings it gave to the federal government include pricing at least 20% below the incumbents’ comparable plans in British Columbia, Alberta and Ontario for ten years. At the same time the CRTC’s wholesale fibre order requires Bell, TELUS and SaskTel, though not the cable companies, to open their fibre networks to competing Internet providers.
An observation that fits this publication: consumers may finally be getting some of the competition politicians spent a decade demanding, and incumbent shareholders are helping pay for it. I would not overdo that. Canada’s market remains concentrated, networks and spectrum remain formidable barriers to entry, and international price comparisons still put Canadian wireless among the more expensive in the developed world even after the recent declines. But the direction matters for valuation, because the profit pool that supported a growing dividend is no longer growing the way it once did, and regulatory pressure falls particularly heavily on Bell and TELUS, where wholesale fibre rules apply. Slowing population growth, which both Rogers and TELUS cited in discussing the operating environment, is a second headwind. None of this makes the businesses poor. It makes them mature businesses whose earnings will increasingly be driven by cost control, customer retention and capital discipline rather than price increases.
Rogers: the stock that almost won
Rogers was my initial winner, and the way it lost is the most instructive part of the research. The case looked excellent on first pass. Management guided 2026 free cash flow to about C$4.1 billion to C$4.3 billion, up from C$3.36 billion in 2025, against a market capitalization of about C$24 billion, which is a free cash flow yield above 17% on management’s number. The dividend consumes about a quarter of that. Leverage has come down from about 5.0 times EBITDA at the end of 2023 to 3.8 times at June 30, 2026. Operating trends are better than TELUS’s: postpaid phone churn of 0.94%, wireless margins of about 66%, cable margins of about 58%, and consolidated EBITDA up about 3%. The dividend freeze that looked embarrassing a few years ago has the look of prudence now that BCE and TELUS have cut theirs.
The problem is capital spending. In every year I could verify between 2017 and 2025, Rogers’ capital intensity, meaning capital expenditures as a share of revenue, was materially higher than it is today, generally falling in roughly the high teens to around 20%. Rogers’ 2026 guidance of C$2.5 billion to C$2.7 billion represents capital intensity of approximately 12%, down from 17% in 2025. Management has real reasons to argue the step-down is structural. Rogers says it is approaching the end of a major investment period after putting approximately C$12 billion into capital expenditures over the previous three years, much of it in wireless and wireline networks and IT infrastructure. Shaw integration spending has also rolled off, and the business may genuinely need less capital than it did during the previous cycle. I do not think the 2026 figure is artificial, and I am not suggesting anyone is manufacturing free cash flow. The economically important question is what Rogers earns if capital intensity settles somewhere between its 2026 level and its historical range.
| Capital intensity | Rogers capex | Approx. owner-cash-flow yield on market cap |
|---|---|---|
| About 11.5–12% (2026 guidance) | ~C$2.6B | ~13% |
| 14% | ~C$3.2B | ~11% |
| 15% | ~C$3.4B | ~10% |
| 16% | ~C$3.6B | ~9% |
| 18% | ~C$4.1B | ~7% |
These are my calculations, not Rogers’ guidance. They use an assumed 2026 revenue base of about C$22.8 billion and treat each additional capital dollar as reducing free cash flow roughly dollar for dollar, while also making approximate adjustments for cash obligations that are not captured in Rogers’ reported FCF definition. The purpose of the exercise is not to claim that C$2.3 billion or C$3.1 billion is the “true” Rogers free cash flow. It is to show how sensitive the valuation is to the assumption that 2026’s unusually low capital intensity persists. Around 15%, I get something close to a 10% owner-cash-flow yield; if capital intensity eventually returns toward 18%, it falls closer to 7%. The same framework produces a ten-year base-case return in my models of roughly 9% to 10%, with a bad case, if capital intensity rises substantially and EBITDA slips, around negative 5%. The exit multiple matters even more than the starting cash flow: a meaningful derating can quickly overwhelm several years of dividends.
Rogers also carries more financial complexity than the other incumbents. It has levered up for Shaw and then for a sports portfolio. It bought the remaining 25% of Maple Leaf Sports & Entertainment for C$4.35 billion at the beginning of October, on top of the C$4.7 billion it paid for Bell’s stake in 2025. It sold a 49.9% interest in a wireless-backhaul subsidiary to Blackstone for C$6.7 billion, in a structure where rating agencies treat the money as equity but where the subsidiary is expected to distribute roughly C$400 million a year to Blackstone for five years. Counting that obligation economically pushes my view of Rogers’ leverage materially above its published 3.8 times, with the precise number depending on how aggressively the Blackstone investment and hybrid securities are treated. The family that founded the company controls it through voting Class A shares while public investors hold non-voting Class B shares. I am not suggesting the structure is a problem in itself, but it does mean minority holders have limited leverage over capital-allocation decisions that have recently been large.
I have deliberately not leaned on the sports assets. Rogers says its sports and media holdings are worth more than C$25 billion, and the MLSE transaction implies a valuation of about C$17 billion for MLSE itself. Those are private-market marks for trophy assets, not prices at which Rogers can necessarily monetize them, and any minority sale that comes in below those marks would leave the stock’s valuation looking less generous. Rogers’ near-term debt schedule is relatively comfortable, with about C$9.9 billion, or roughly 27% of long-term debt, maturing through 2030, about 89% of its debt at fixed rates, and an average term of about 8.6 years. Rogers becomes genuinely interesting if lower capital intensity proves durable, and I would want to see capital intensity stay at or below roughly 14% to 15% through 2027 while leverage falls. At C$43.94 the investor is being asked to assume too much of that outcome in advance.
TELUS: the contrarian candidate
TELUS is the most interesting valuation story in the group because so much bad news is already in the price. At C$11.47 the stock has undergone an enormous repricing, and the second-quarter release was an inventory of disappointments: the dividend reset, free cash flow guidance cut to about C$1.8 billion, EBITDA now expected to fall 2% to 4% in 2026, and a non-cash impairment of about C$2.1 billion at TELUS Digital, the outsourced customer-experience and data business, which followed another substantial impairment a year earlier. TELUS had also paid about C$754 million in October 2025 to buy out the minority shareholders in TELUS Digital, which was poorly timed in hindsight. TELUS Health, the other diversification, has also struggled to produce the kind of growth that once justified the diversification story. Management raised the dividend, paused further increases and then cut it within eight months, while pushing its leverage target farther into the future.
On the other side, the company’s reset dividend of C$0.75 consumes about 66% of guided free cash flow, which in TELUS’s case is already after lease principal and restructuring, so the number is not flattered in the same way as some competing FCF measures. The owner-cash-flow yield at today’s price is about 10%, among the best in the group, and 2026 free cash flow includes elevated restructuring spending that should not continue indefinitely at the same level. TELUS’s debt is overwhelmingly fixed-rate at an average cost of roughly 4.8%, with a stated average term of nearly 15 years, and its fibre and wireless franchises remain formidable. If EBITDA merely stabilizes, the earnings power of the business at this price looks substantial. It is difficult to find a major Canadian company on which so much negative expectation has already been priced in.
The balance sheet needs more care than the headline leverage of 3.5 times suggests. TELUS receives equity credit for junior subordinated notes in calculating its leverage, and treating those hybrids more conservatively, which is how I prefer to think about them economically, brings leverage closer to 4.0 times. The long average debt term is also less comforting than it first appears because long-dated hybrid securities extend the average; a meaningful share of conventional debt still comes due by 2030. Refinancing that at higher rates is manageable but it is not trivial against about C$1.8 billion of annual free cash flow. My scenario work puts a base-case return near 10% a year, a bad case around flat to slightly negative, and an upside case in the mid-teens, with considerable sensitivity to the exit multiple. I won’t describe TELUS as a value trap, because nothing here proves that, and an investor who buys it near C$10 or sees two quarters of stable EBITDA would be taking a different bet than one buying at C$11.47 on hope. It is the closest stock in the group to becoming attractive. It simply isn’t attractive enough yet to compensate for management that has missed repeatedly.
Quebecor: the company I like best
If I had to own one of these businesses for a decade without looking at the price, it would be Quebecor. Published leverage is about 2.9 times, the lowest of the five by a clear margin, and it has fallen for three years running; net debt dropped substantially in 2025. Freedom Mobile has become the most credible national challenger in a market where previous entrants mostly struggled. Quebecor added about 311,000 mobile lines in 2025, growing the base by roughly 7.6%, and it has been buying back stock steadily. The dividend payout is about 40% of my normalized owner cash flow, the dividend has risen twice in 2026 to an annualized C$1.80, and the company’s capital-allocation record, with Freedom, buybacks, deleveraging and a restrained approach to dividends, compares well with its peers.
The 2025 free cash flow figure, however, shows why cash-flow quality matters. Quebecor reported free cash flow of about C$1.43 billion, up about 27%, which looks spectacular. But working capital contributed about C$305 million of that, compared with only about C$22 million the year before. Removing that swing leaves underlying cash generation much closer to the previous year’s level. On my calculations, free cash flow excluding working-capital movements rose from about C$4.42 per share in 2023 to C$4.74 in 2024 and C$4.88 in 2025. That is healthy, with lower interest costs doing some of the work, but it is mid-single-digit growth, not 27%. Freedom’s growth also comes at lower average revenue: Quebecor’s mobile ARPU was around C$35 against roughly C$56 at TELUS, though the companies define the measure differently. The market has noticed the quality.
At C$62.35 Quebecor trades at about 8.6 times EBITDA, compared with lower multiples for the three large incumbents once hybrids and similar claims are counted, and its normalized owner-cash-flow yield is about 7%. My scenario work produces a base case near 9% a year, a bad case still modestly positive, and an upside case around 12% to 13%. The downside is the best in the group, which is the whole point of buying quality. But a roughly 9% expected return from a better business is not an obviously large premium over the market, and the current price requires meaningful per-share cash-flow growth to generate a double-digit long-term return. Around C$55 the picture improves considerably, and I would be comfortable underwriting it there. This is the cleanest illustration of something I keep rediscovering: the best company and the best stock are not necessarily the same thing.
BCE: what happened to the bond proxy
BCE deserves a serious assessment, not a mocking one. For years it was the cornerstone Canadian income holding, and it did not become a bad company overnight. The dividend now stands at C$1.75, a yield of about 6.2% at C$28.17. The company bought Ziply Fiber in 2025 for about C$5 billion in cash and about C$2.65 billion of assumed debt, at a substantial multiple of EBITDA even after expected synergies, funded in part by selling its stake in Maple Leaf Sports & Entertainment. It is simultaneously spending heavily on fibre and on a large Saskatchewan data-centre project. Leverage is about 3.7 times on its own definition and higher when hybrid securities and preferred shares are treated fully as debt-like claims.
The analytical question is lease-adjusted free cash flow, and the answer depends on the year. In 2025, BCE generated C$3.178 billion of reported free cash flow and paid C$1.127 billion of lease principal, leaving C$2.051 billion of free cash flow after payment of lease liabilities. Against roughly C$1.63 billion of annual dividends at the new rate, that is a payout of about 80%. For 2026 BCE has guided reported free cash flow to C$2.1 billion to C$2.3 billion while capital intensity rises sharply because of incremental data-centre spending. If lease principal remains around recent levels, after-lease cash generation could fall to roughly C$1.0 billion to C$1.3 billion, meaning the current dividend would be uncovered in the trough year. That is a long way from saying the dividend is permanently unsustainable. Management is targeting substantial recovery in after-lease free cash flow by 2028, and if 2026 really is a peak-investment year, the picture improves quickly.
My difficulty is that a new investor has to bet on that recovery without much evidence, and BCE has not recently been the company whose guidance one wants to take on faith. BCE’s after-lease cash yield at today’s price is only about 4% to 5% using that rough 2026 estimate and about 8% at the 2025 level. My base-case return is near 9%, with a bad case modestly negative. Nothing here says avoid BCE forever. It says that at C$28 I would be paying a fair price for a recovery that has not been demonstrated, while TELUS offers a similar expected return at a much higher current cash yield. Around C$23, with after-lease free cash flow again covering the dividend and leverage clearly heading toward the company’s 3.5 times target, I would pay attention.
Cogeco: the tempting yield
Cogeco Communications is the oddball, and it is where a headline screen can mislead most. The stock yields about 7.6% at C$52, the dividend takes only a modest share of reported free cash flow, reported free cash flow is large relative to its roughly C$2.2 billion market capitalization, and the whole enterprise trades at a low headline EBITDA multiple. Anyone running a dividend screen would call that a bargain.
The difficulty is Breezeline, its U.S. cable business, which accounts for a substantial portion of EBITDA and where conditions are deteriorating. In its fiscal third quarter Cogeco recorded a non-cash pre-tax impairment of about C$2.2 billion on the U.S. segment. U.S. revenue fell 10.1% and U.S. adjusted EBITDA fell 10.0%, while the Canadian operation was healthier, with adjusted EBITDA up 3.9%. A Quebec pension investor owns 21% of Breezeline. The research could not allocate the company’s debt, cash flow and that minority interest cleanly enough between Canada and the United States for me to translate the spectacular consolidated yield into a precise amount of owner cash flow attributable to Cogeco’s common shareholders.
What I can do is read the price. At about C$52, my sum-of-the-parts work suggests the market is roughly valuing the Canadian operation around six to seven times EBITDA and the American operation around two to three times. That is not obviously irrational, because Quebecor trades at a considerably higher multiple while a business whose EBITDA is falling around 10% deserves a very low one. The valuation range if you vary those two multiples is enormous, which is really a statement that I cannot underwrite this stock confidently enough with the information available. It is an interesting special situation, and I would give it a small speculative allocation at best. It is not a candidate for a C$10,000 decision made on the headline numbers, and its yield is not the reason to own it. Cogeco’s parent, Cogeco Inc., looked briefly like a holding-company discount, but once the parent’s own debt is counted the apparent discount largely disappears.
What the numbers add up to
The table below pulls together the comparison I find most useful: the headline dividend yield, the owner-cash-flow yield, what share of owner cash flow the dividend consumes, and a more economic view of leverage where I can reasonably estimate it. The figures are rounded deliberately; they combine reported results, company guidance and my own adjustments, and several of the Rogers and Cogeco inputs are assumptions that I do not want to imply are more precise than they are.
| Company | Price | Dividend yield | Owner-cash-flow yield | Dividend as share of owner cash flow | Economic leverage | Assessment |
|---|---|---|---|---|---|---|
| BCE | C$28.17 | ~6.2% | ~8% at 2025 after-lease level; ~4–5% on rough 2026 after-lease estimate | ~80% (2025); over 100% on rough 2026 estimate | ~4.1x | At risk |
| TELUS | C$11.47 | ~6.5% | ~10% | ~66% | ~4.0x | Adequate |
| Rogers | C$43.94 | ~4.6% | ~10% at 15% capital intensity | ~47% | ~4.9x estimate | Safe if lower capex persists |
| Quebecor | C$62.35 | ~2.9% | ~7% | ~40% | ~2.9x | Safest |
| Cogeco | C$52.14 | ~7.6% | Very high but difficult to attribute precisely | ~30% on reported FCF | ~3.2x (published) | Structurally uncertain |
My scenario work for the four companies I could model clusters around 9% to 10% a year over ten years in the base case, with substantially different downside outcomes. These are not forecasts. They are outputs of a framework that starts from owner cash flow, applies assumed growth, a plausible exit multiple, dividends and some debt reduction, and they are more sensitive to the exit multiple than to anything else. I trust their ordering more than their exact levels. The comparison I care about is against the alternative, a diversified equity portfolio, for which long-term return assumptions published by large institutions are generally in the mid-to-high single digits. Vanguard’s latest model, for example, anticipates roughly 4% to 6% a year for U.S. equities over the next decade. A concentrated telecom position does not need to beat that estimate by a decimal point; it needs to beat the diversified alternative by enough to justify taking the additional company-specific risk.
Taxes do not rearrange the ranking. Canadian telecom dividends are generally eligible dividends. In a TFSA, dividends and gains are tax-free; in an RRSP they compound tax-deferred and withdrawals are eventually taxable as ordinary income; and in a taxable account eligible dividends receive Canada’s 38% gross-up and dividend-tax-credit treatment. I work through those mechanics separately in my Dividend Tax Treatment in Canada guide. Capital gains remain subject to a 50% inclusion rate in 2026: the proposed increase to two-thirds was ultimately abandoned and never came into force, something I cover in more detail in Capital Gains Taxes in Canada. The practical point here is simpler: a high dividend yield is worth less in a high-income taxable account than the headline yield suggests. Tax treatment moves the numbers somewhat, but it does not materially change my ranking of the telecom stocks.
The moral hedge, priced
Back to the premise. Suppose I want to be paid enough in dividends from one of these companies to cover C$3,000 a year of telecom bills, and suppose I am an Ontario investor with about C$150,000 of taxable income, so that the dividends are taxed at a meaningful marginal rate. Using today’s yields and approximate tax assumptions, that takes roughly C$65,000 of BCE, C$61,500 of TELUS, C$88,000 of Rogers, C$139,000 of Quebecor and C$53,000 of Cogeco. Before tax the BCE figure would be about C$48,000. These are illustrations rather than account-specific tax calculations, and they assume the dividends remain at their current levels.
It takes roughly C$65,000 of BCE to make Bell pay a C$250 monthly Bell bill, and BCE has already shown that its board can cut your rebate by more than half. The figures also reveal why the exercise is a poor way to choose a stock. It rewards the highest yield, which is exactly the wrong filter, as the last two years demonstrated, and it points investors toward a sector they already own through broad funds. A broad Canadian equity fund already contains BCE, TELUS and Rogers, along with indirect exposure to Quebecor depending on the index. As a way of thinking about telecom spending the moral hedge is amusing and even slightly useful. As an investment strategy it is a dangerous excuse to overweight a mediocre sector.
The C$10,000 decision
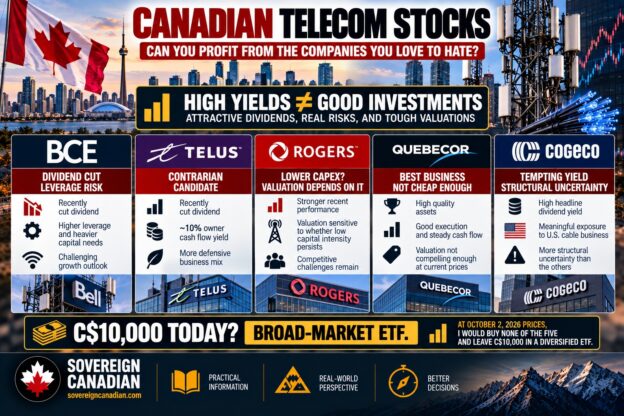
Here is the situation I used to test myself. I already own diversified Canadian and U.S. equity funds, so I already have indirect telecom exposure. I have C$10,000 available, I do not need the income, my horizon is ten years or more, I care about total return more than yield, I dislike excessive leverage, and I am willing to buy an individual stock when the price gives me a real margin of safety. On October 2, 2026, with these five stocks at the prices above, I would buy none of them. I would leave the money in a broad-market ETF.
That is a decision, not a refusal to make one. The base-case returns I get cluster around 9% to 10%, with meaningful uncertainty, and the downside cases are poor for some of the more leveraged names. A broad portfolio may reasonably produce something in the mid-to-high single digits over a long period. That leaves a theoretical advantage of perhaps a few points, available only if several assumptions cooperate, in exchange for concentrating money in one leveraged company that I already own through my funds. I do not treat 10.5% as an objectively correct required return. It is my own margin-of-safety requirement. If I am going to replace diversified ETF money with a single leveraged telecom, I want something closer to an expected double-digit return with credible downside protection, not a spreadsheet suggesting I might earn a point or two more if the capital-spending, EBITDA and multiple assumptions all break my way. None of the five clears that bar today. TELUS comes closest on valuation, and Quebecor has the best downside protection, but neither is both cheap enough and safe enough.
What would change my mind
These are watch prices, not price targets. Each is paired with something I would want to see in the results, because a lower price alone does not fix a deteriorating business.
| Company | Current | Watch price | What else I would want to see |
|---|---|---|---|
| TELUS | C$11.47 | About C$10 or below | EBITDA stops falling for two consecutive quarters; restructuring and capex reductions prove durable |
| Quebecor | C$62.35 | About C$55 or below | Could justify more if free cash flow per share excluding working capital grows 6% or more and leverage keeps falling |
| Rogers | C$43.94 | About C$37 or below, unless operations improve first | Capital intensity stays near or below 14–15% through 2027 while leverage falls |
| BCE | C$28.17 | About C$23 or below | After-lease free cash flow clearly covers the dividend; leverage moves toward 3.5x |
| Cogeco | C$52.14 | About C$37 or below, as a reason for deeper work | Clear Breezeline debt and minority-interest economics; U.S. deterioration stabilizing |
If I rank them as businesses and as risk-reward propositions today, my order is Quebecor first, TELUS second, Rogers third, Cogeco fourth and BCE fifth. Quebecor is the best overall investment quality in the group, TELUS the best contrarian opportunity, Rogers potentially attractive if its lower capital spending is structural, Cogeco a speculative special situation and BCE the weakest current risk and reward. But ranking first does not mean buy. Quebecor can be the best telecom investment in the group and still not be cheap enough for me to purchase, and at C$62 that is where I land.
The moral hedge can wait
Canadian telecom stocks are not uninvestable. After the damage of the past few years several of them are becoming interesting, and a couple of the companies are better businesses than the market’s mood suggests. But being down a lot does not make a stock cheap, and a 6% dividend does not make it safe, which BCE and TELUS spent the last two years teaching everyone who held them for income. Quebecor is the company I like best. TELUS is the valuation I am watching most closely, and Rogers could become considerably more attractive if its lower capital requirements prove permanent.
For now, though, I already own Canadian telecom through my funds, and I do not need to turn my irritation with the monthly bill into a concentrated investment. The statement will keep arriving. The moral hedge can wait for a better price.
For more on how I think about allocating capital across Canadian investments, see the Sovereign Canadian Finance & Tax hub.