
Prem Watsa has been called Canada’s Warren Buffett for so long that the label has become part of Fairfax Financial’s identity. The comparison isn’t careless. Both men built holding companies around property-and-casualty insurance, used the premiums their insurers collect to fund long-term investing, wrote candid annual letters, and judged themselves by growth in book value per share over decades. By Fairfax’s own accounting, book value per share has compounded at 18.7% a year since 1985, including dividends. Few Canadian companies can point to anything like that.
The record isn’t a straight line, though. Fairfax compounded spectacularly in the 1980s and 1990s, made a fortune on credit-default swaps in 2007 and 2008, and then spent most of 2011 to 2020 growing book value at roughly 2.4% a year while hedging a market that kept rising. From 2021 to 2025 book value per share compounded at 22.5% a year, the combined ratio fell below 94%, and the stock went from about 0.7 times book value (end of 2020) to about 1.5 times (end of 2025).
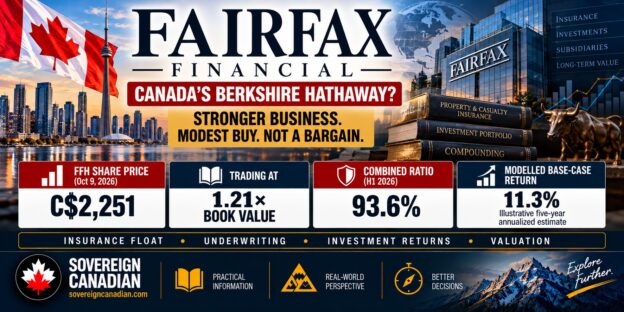
That recovery changes the question. Whether Watsa can repair Fairfax has been answered. What remains is whether the repaired Fairfax can earn enough on its equity to justify about 1.2 times book value. My answer is that it probably can, with a margin of safety thin enough that I’d call the stock a modest buy rather than a bargain.
A note on currency. Fairfax reports in US dollars and trades on the TSX in Canadian dollars, so I label every figure USD or CAD. Prices are the October 9, 2026 closes (Fairfax CAD 2,250.89; Berkshire’s B shares USD 515.62), converted at 1.4256 CAD per USD. Return figures are my own modelled estimates, not guidance or analyst consensus.
What Does Fairfax Actually Own?
Fairfax is a Canadian holding company that owns property-and-casualty insurers and reinsurers, invests the money they hold, and owns equity stakes and a handful of operating businesses. Insurers collect premiums up front and pay claims later, sometimes years later. The money in between, called float, is eventually owed to policyholders, but until then Fairfax invests it. If claims and expenses come in below premiums, meaning a combined ratio under 100%, the float is effectively free capital. Fairfax’s float was USD 40.8 billion at the end of 2025.
The insurers are the core. Odyssey is the reinsurance and specialty engine (about USD 6.0 billion of net premiums written in 2025), Allied World was bought in 2017 for USD 4.2 billion and wrote about USD 5.1 billion, Crum & Forster is a US specialty arm, Northbridge is the Canadian commercial insurer, and Brit and Ki provide a Lloyd’s presence.
What separates Fairfax from a pure insurer is the size of the portfolio relative to equity. At June 30, 2026 the portfolio was USD 75.9 billion against common equity of USD 26.0 billion, or 2.9 times equity, funded by float, equity and about USD 11.4 billion of debt. That leverage is why a 5% bond yield produces USD 2.6 billion of annual interest and dividends, and why Fairfax depends on investing as much as underwriting.
Associates and operating businesses are secondary. Fairfax owns large stakes such as Eurobank in Greece and Digit Insurance in India, and consolidates companies including Recipe Unlimited, Bauer and Sleep Country, which produced USD 8.5 billion of revenue but only USD 397 million of operating income in 2025. Together they are about a fifth of my normalized pre-tax operating income. Fairfax is an insurance-and-investment company first, unlike Berkshire, where the railroad, utilities and manufacturing businesses produce about 60% of operating earnings.
The Transformation: Three Fairfaxes
The first Fairfax compounded book value at 57.7%, 21.2% and 30.7% a year across the five-year blocks from 1986 to 2000, though from a tiny base. After a weak 2001 to 2005, a credit-default swap and equity hedge program (roughly USD 0.5 billion of cost, then gains of roughly USD 4.5 billion to USD 4.7 billion in 2007 and 2008, per secondary sources) helped deliver 24% a year from 2006 to 2010. That windfall explains much of why the 40-year record looks so strong, and it was a macro bet, not an underwriting achievement.
The second Fairfax is the lost decade. Starting in 2010 the company hedged its equity portfolio against a market decline, at times by more than the portfolio’s value. Markets rose and the hedges lost somewhere between USD 3.6 billion and USD 4.4 billion, depending on the source, while very short bond duration left interest and dividend income at only USD 0.64 billion in 2021. Book value per share went from USD 376 in 2010 to USD 478 in 2020. That is the strongest argument for skepticism about Watsa’s macro calls. Fairfax removed the index hedges in November 2016, late but decisively.
The third Fairfax is the recovery. Underwriting profit rose from a loss of USD 0.6 billion in 2017 to USD 1.8 billion in both 2024 and 2025, and interest and dividends rose from USD 0.64 billion in 2021 to USD 2.57 billion in 2025 as the short bond book repriced. Repurchases cut the share count 28%, from 27.8 million in 2017 to 19.97 million by mid-2026. Eurobank, bought during the Greek crisis for roughly EUR 1.2 billion and worth about EUR 4.6 billion in February 2026, was a genuinely excellent investment.
| Year | Combined ratio (undiscounted) | Underwriting profit (USD billions) | Interest and dividends (USD billions) | Investment portfolio (USD billions) |
|---|---|---|---|---|
| 2018 | 97.3% | 0.3 | 0.8 | 38.8 |
| 2020 | 97.8% | 0.3 | 0.8 | 43.2 |
| 2022 | 94.7% | 1.1 | 1.0 | 55.5 |
| 2025 | 93.0% | 1.8 | 2.6 | 74.9 |
Source: Fairfax annual reports and shareholder letters. The portfolio is net of derivative obligations.
Some of this is structural: premiums quadrupled in a decade, the hedges are gone, and the investment process looks more disciplined. But much of it is cycle. The combined ratio improved from 97.8% to 93.0% during the strongest insurance pricing in a generation, and the higher interest income came from a rate regime that has probably peaked. Nobody outside the company can cleanly split skill from cycle, though the ratio held near 93% through 2025’s USD 1.2 billion of catastrophe losses and hasn’t deteriorated in 2026, which suggests some of it is real.
How Good Is Fairfax’s Insurance Business?
A combined ratio adds an insurer’s claims and expenses and divides by premiums earned, so below 100% means an underwriting profit. Fairfax’s was 93.0% in 2025 (per its 2025 results release) and 93.6% in the first half of 2026, compared with an average of 98.3% in 2016 to 2020 and 106.7% in 1986 to 1990. Each point is worth roughly USD 270 million before tax, or about USD 9.70 per share after tax and minority interests. Under IFRS 17 a second, “discounted” ratio exists (82.3% in the first half of 2026) that credits the time value of reserves; I use the undiscounted figure peers report.
Against peers Fairfax is good, not best in class. Chubb reported 83.8% in the second quarter of 2026 and Travelers 86.1% for the first half, according to Travelers’ release. Berkshire’s three insurance groups ran at roughly 90% in the first half including life and health, which isn’t like for like. Allowing for differing periods and definitions, I’d call the gap three to ten points, partly mix: more reinsurance and specialty business, and Zenith’s workers’ compensation unit at 102% in 2025.
The reserve-release question
The most important caveat about those profits is reserve releases. Insurers reserve for claims they expect to pay, and when reserves prove too high the excess flows back into earnings as favourable prior-year development. In 2025 that was USD 751.5 million, about 41% of the USD 1,816.6 million underwriting profit and 2.8 points of combined ratio. Without it the ratio would have been about 95.8%.
There are two lazy readings. The sceptical one treats releases as a cushion that disappears when exhausted. The charitable one treats Fairfax’s 19 consecutive years of favourable development (about USD 6.9 billion, by the company’s account) as proof they’re permanent. A release is the delayed recognition of caution booked earlier, so a steady stream is plausible while new business is reserved the same way. But the amount varies, and it can shrink if loss trends worsen, especially in US casualty, or if part of it is risk-adjustment run-off that doesn’t repeat.
I tested three treatments, assuming a combined ratio before releases of 96.0%, a bit worse than the 2021 to 2025 average of 95.6% to allow for a softer market. Releases averaged 1.9 points of premiums over that period, within a range of 0.9 to 2.9.
| Treatment of releases | Combined ratio | Normalized underwriting profit (USD millions) | EPS excluding gains (USD) | Normalized ROE | P/E at USD 1,579 | Fair value (CAD) | Base-case 5-year return |
|---|---|---|---|---|---|---|---|
| Zero | 96.0% | 1,080 | 125 | 9.6% | 12.6x | 2,320 | 10.7% |
| About 1 point (my central case) | 95.0% | 1,350 | 134 | 10.3% | 11.8x | 2,380 | 11.3% |
| 1.9 points (2021 to 2025 average) | 94.1% | 1,593 | 143 | 11.0% | 11.1x | 2,435 | 11.8% |
| 2.8 points (2025 level) | 93.2% | 1,836 | 151 | 11.6% | 10.4x | 2,489 | 12.3% |
Source: my calculations from Fairfax reported figures. Fair value is the price today that delivers a 10% annual return. All figures exclude the normal investment gains I model separately.
Earnings per share move about 20% from one end to the other, but fair value moves only from CAD 2,320 to CAD 2,489 and the base-case return from 10.7% to 12.3%. At CAD 2,251 the stock trades 3% to 10% below fair value in every case. The treatment of releases decides how undervalued Fairfax appears in this model, not whether it is below the modelled fair values. I use the roughly one-point case as central, zero releases as the conservative sensitivity, and the 2025 level as a ceiling.
The Investment Portfolio
Investment income is now the second pillar of Fairfax’s earnings, and the most rate-sensitive. About 56% of the portfolio is bonds (USD 43.1 billion) and another 11% is cash and short-term investments; roughly 77% of the fixed income is US Treasuries and other government bonds. Duration is about two years at a yield near 5%, short for an insurer. That cost income in 2010 to 2021 and spared Fairfax the bond losses of 2022, and it means the portfolio reprices quickly if rates fall.
Falling rates aren’t simply bad. Bond prices rise, equity multiples tend to expand, and book value benefits near term. But earnings power erodes. In my model a 100 basis point decline in reinvestment yields costs about USD 130 million pre-tax in year one and about USD 460 million by year five, roughly USD 16 per share after tax, or 12% of normalized earnings excluding gains. A one-time bond gain of about USD 34 per share softens that but is smaller than the roughly USD 51 per share of income lost over five years, and it shifts weight onto underwriting just as the pricing cycle softens.
On the equity side, market values diverge from the accounts. Fairfax owns 32.1% of Eurobank, carried at USD 2.78 billion against a market value of USD 5.55 billion. Across listed associates and consolidated listed subsidiaries, fair value exceeds carrying value by USD 4.4 billion, none of it in book value. In the second quarter Fairfax sold 23.1% of Poseidon for USD 1.9 billion, realizing a USD 838 million gain, while Quess and Helios trade below carrying value. Eurobank alone is worth about 17.8% of Fairfax’s market capitalization, so a Greek banking problem would show up directly in the stock.
What Is Fairfax Actually Worth?
Trailing price-to-earnings is the least reliable guide. Fairfax earned USD 203.75 per share over the past twelve months, putting the stock on 7.7 times, but that includes large investment gains, among them the Poseidon gain, that won’t recur at that scale. A better baseline is normalized earnings of about USD 134 per share excluding gains, or about USD 166 with USD 800 million of pre-tax gains, which a large actively managed portfolio can reasonably produce in an average year. On those figures the stock trades at 11.8 and 9.5 times: ordinary multiples, not bargains.
| Measure (October 9, 2026) | Value |
|---|---|
| Share price | CAD 2,250.89 (USD 1,579 at 1.4256) |
| Market capitalization | USD 31.5 billion (CAD 45.0 billion) |
| Book value per share, June 30, 2026 | USD 1,304.39 (about CAD 1,860) |
| Price to reported book value | 1.21x |
| Price to adjusted book value | about 1.06x (1.04x to 1.07x) |
| Trailing P/E | 7.7x |
| Normalized P/E, excluding / including modelled gains | 11.8x / 9.5x |
| Normalized ROE | about 10% to 13% |
| Dividend yield (USD 15 a year) | 0.95% |
Source: Fairfax Q2 2026 interim report for book value and earnings; my calculations for the rest.
Reported book value is the best first anchor for a company like this, but it understates value in places. Equity-method stakes such as Eurobank are carried well below market, and conservative reserves are a hidden asset of unknown size. Adding the USD 4.4 billion gap, with haircuts of up to 25% for tax and minority interests, gives adjusted book value of roughly USD 1,470 to USD 1,525 per share, and a price of about 1.06 times it. The old discount, when hedging mistakes held the stock at 0.7 times book, has largely been arbitraged away; at 1.21 times, Fairfax sits near its 20-year median of 1.16 times.
The sustainable ROE that today’s price requires can be backed out of the standard relationship in which justified price-to-book equals (ROE minus growth) divided by (required return minus growth). A 9% to 10% required return and 3% growth imply an ROE of roughly 10% to 11.5%. My normalized range is 10% to 13%, so the price fairly pays for the central case, and value appears only if ROE holds above about 12% or the stock falls. Against my central fair value of about CAD 2,380 the margin of safety is about 5%, and against the low case it is negative. That is how Fairfax can look very cheap on trailing earnings and offer only a modest margin of safety.
Can Fairfax Keep Compounding?
For a 10 to 20 year horizon I’d use ranges, not the last five years. Book value per share grew 12.1% a year over ten years and 8.4% over fifteen, excluding dividends. My central long-run range is 8% to 10% a year, with a low case of 5% to 6% and a high case of 12% to 13%. Pricing is softening, interest income will probably drift down, and it is hard to compound a USD 26 billion equity base above 12% without adding leverage. Buybacks can add one to two points a year to per-share growth, but only when done below intrinsic value, and the first-half 2026 repurchases were made at about 1.25 times book.
From today’s price, with the multiple unchanged at 1.2 times book, an 8% return needs book value growth of about 7%, roughly my low case: a combined ratio of 97% to 98% and lower rates. A 10% return needs about 9%, with a combined ratio near 95%, flat rates and normal gains, close to my base case. A 12% return needs about 11%, the 2024 to 2025 profile sustained. A 15% return needs about 14%, a return on equity near 17% for five straight years, or a re-rating to about 1.5 times book on top of solid growth. That is 2021 to 2025 repeated on a bigger base, and I wouldn’t underwrite it. Eight to ten per cent is a reasonable expectation; fifteen per cent is a wish.
Succession is the variable that doesn’t fit a spreadsheet, and I return to it below. For a different Canadian compounding model, see Brookfield’s Canadian investment platform.
Is Fairfax a Dividend Stock?
No. Fairfax pays USD 15 per share once a year, in January, a yield of 0.95% at the reference price. The dividend has risen once in a decade, from USD 10 to USD 15, and the company says each payment is not indicative of future ones. The payout is about 11% of my normalized earnings excluding gains, so the dividend appears well covered and could be raised easily, but management prefers retention and buybacks: the USD 1.72 billion repurchased in the first half of 2026 was more than five times the USD 329 million annual dividend. Fairfax’s investor page states that its dividends are eligible dividends for Canadian tax purposes, though the designation should be checked on each year’s tax slip. Fairfax is a total-return stock. Investors who need income should look at Canadian utility stocks or Canadian bank stocks.
Prem Watsa and Warren Buffett
The comparison is justified on philosophy. Both emphasize long-term ownership, margin of safety, float as cheap capital and per-share intrinsic value, and both write long letters that admit mistakes. Both exercise effective control, Watsa explicitly through multiple-voting shares. Watsa’s salary is CAD 600,000, and he has received no bonus or equity awards since 2000, which is a mark of alignment.
The differences matter more to an investor. Fairfax is more leveraged: its portfolio is 2.9 times equity, while Berkshire’s investments are about 0.9 times equity, with roughly USD 248 billion of cash and Treasury bills net of consolidated borrowings, although subsidiary debt and insurance liquidity needs make this an imperfect measure of deployable cash. Berkshire is far more diversified, with about 60% of operating earnings from outside insurance against roughly 80% of Fairfax’s from underwriting and investment income. Fairfax has a macro-hedging history that Berkshire avoids, and its underwriting is a few points behind. Concentration is more nuanced than it looks: by business line Fairfax is more concentrated, but by holding the picture is similar, with Eurobank about 18% of Fairfax’s market value and Berkshire’s five largest stocks (Alphabet, American Express, Apple, Bank of America and Coca-Cola) about 19% of Berkshire’s.
Governance and succession are the starkest difference. Berkshire’s handover from Buffett to Greg Abel as CEO took effect on January 1, 2026; Buffett became chairman emeritus and Howard Buffett became chairman in September 2026. Fairfax’s hasn’t happened. Watsa is 75, remains chairman and chief executive, and controls 43.3% of the votes with about 10% of the economic interest through multiple-voting shares. Peter Clarke is president and chief operating officer, Wade Burton is chief investment officer, and secondary sources expect Ben Watsa to become chairman, but I found no named CEO successor. The multiple-voting structure requires a shareholder vote within five years after Watsa ceases to be both chairman and CEO.
I’d credit Watsa with the 1985 to 2000 compounding, Eurobank, Allied World, the bond positioning before 2022 and the buybacks when the stock traded below book. The 2010s hedging was his mistake. He isn’t interchangeable with Buffett: a talented but more volatile allocator running a more leveraged vehicle.
Fairfax or Berkshire: Which Would I Buy Today?
Berkshire is generally the stronger business, while Fairfax may be the more attractive stock at current prices. Those are different claims, and for many Canadian investors the practical question isn’t either/or. If you already own both and intend to keep both, with roughly ten dollars of Berkshire for every dollar of Fairfax, where should the next CAD 5,000 go?
I rebuilt the Berkshire valuation from its second-quarter 2026 10-Q to answer that. At USD 515.62 (about CAD 735) the B shares trade at about 1.48 times book and 24.5 times my normalized operating earnings of about USD 45 billion. Berkshire holds USD 360.0 billion of cash and Treasury bills against USD 128.6 billion of borrowings, mostly at the railroad and utilities. A sum-of-the-parts calculation values the operating businesses at today’s price only if they deserve about 15.5 times earnings with the cash counted at face value. That is a fair price for an excellent business, not a cheap one.
| October 9, 2026 | Fairfax (FFH) | Berkshire (BRK.B) |
|---|---|---|
| Price to book | 1.21x | 1.48x |
| Normalized earnings multiple | 11.8x excluding gains | 24.5x operating earnings |
| Normalized earnings yield | about 8.5% | about 4.1% |
| Balance sheet | Debt to capital 28%, interest coverage 11x | Cash/T-bills less consolidated borrowings about USD 248 billion (not freely deployable) |
| Combined ratio, first half 2026 | 93.6% | about 90% (three insurance groups, including life) |
| Volatility / worst drawdown, 10 years | 24.6% / -51% | 17.9% / -24% |
| 5-year return: bear / base / bull | 0.8% / 11.3% / 18.2% | 0.1% / 6.0% / 10.5% |
| Probability-weighted return | 10.4% | 5.6% |
| CAD 5,000 after 5 years, compounded at weighted annual rate | about CAD 8,190 | about CAD 6,580 |
Source: my calculations from Fairfax and Berkshire filings and monthly price data. Probability weights of 25%, 50% and 25% are my own judgement. Confidence is moderate to low for both, and lower for Berkshire.
A gap of about 4.8 percentage points sounds decisive, and it deserves care. Eleven per cent against eight per cent for ten years turns CAD 5,000 into CAD 14,200 versus CAD 10,800, but that assumes the difference persists. My estimates carry an error of perhaps two points each, and the annual gap between these stocks is volatile enough that Berkshire would still finish ahead after five years about one time in three even if my expected returns were exactly right.
The portfolio-weight effect is small, and that matters. Take a hypothetical CAD 100,000 in Berkshire and CAD 10,000 in Fairfax. Adding CAD 5,000 to Berkshire leaves Fairfax at 9.5% of the Berkshire position and 8.7% of the pair. Adding it to Fairfax raises those to 15% and 13%. Fairfax is riskier on its own, but the two stocks are only about 0.5 correlated, so the pair’s volatility barely changes (17.3% versus 17.5%), and the added Fairfax-specific risk is about CAD 1,100 of one-standard-deviation annual swing. Fairfax being riskier is true. Two extra shares making the portfolio meaningfully riskier is not.
I wouldn’t buy Fairfax for diversification alone. It doesn’t diversify away insurance or underwriting-cycle exposure, and it increases rather than diversifies away much of a portfolio’s existing US-dollar economic exposure, although Fairfax is more geographically and currency-diverse than Berkshire (I estimate roughly 75% to 80% US-dollar-linked against more than 90% for Berkshire, the latter unsourced). It does add a different geography, equity book and set of decision-makers. The case rests on price: the extra CAD 5,000 has the higher modelled expected annual return in Fairfax, so I’d put it there, two shares at about CAD 4,500, and keep Berkshire as the larger core my Berkshire Hathaway analysis.
The call changes with prices. Holding Berkshire constant, Fairfax is a clear favourite for the marginal dollar below about CAD 2,320, a modest favourite up to roughly CAD 2,520, and roughly indifferent from there to about CAD 2,745, above which Berkshire wins. Holding Fairfax constant, Berkshire becomes about as good a home at roughly USD 455 and clearly better near USD 416. These levels come from the return models and aren’t trading signals; within two points of difference I’d call it a toss-up.
Where Should Canadians Hold Fairfax: TFSA, RRSP or Taxable?
Fairfax is one of the more tax-efficient stocks to hold in a non-registered account. The yield is below 1%, the dividend is eligible for the dividend tax credit, and nearly all the expected return is capital appreciation, taxed once at sale with 50% of the gain included in income, on a timetable you control.
I tested whether the TFSA is automatically better. On CAD 5,000 held five years under my three scenarios, using illustrative Ontario bracket assumptions that I haven’t verified, the TFSA saves a probability-weighted CAD 700 to CAD 900 for Fairfax versus a taxable account, against roughly CAD 340 to CAD 420 for Berkshire, because shelter is worth more on the faster-growing asset. In the base case, holding Fairfax taxable costs about 9% to 12% of the final value in tax: a real advantage for the TFSA, but not an overwhelming one.
The taxable account offers something the TFSA doesn’t. A capital loss inside a TFSA is gone, and the room it used doesn’t come back: a 30% fall on CAD 5,000 reduces the account value by CAD 1,500 without creating replacement contribution room. In a taxable account the same loss can be harvested against gains, subject to the 30-day superficial-loss rule, and is worth a few hundred dollars in tax. For a stock that is down about 14% this year, with a worst historical drawdown of 51%, that matters. Both accounts are excellent homes for Fairfax, for different reasons: the TFSA wins on expected value, taxable on flexibility.
The RRSP is often third, though not because it is a poor account. At equal marginal rates in and out it is arithmetically equivalent to a TFSA. But RRSP room is scarce, withdrawals are taxed as ordinary income without capital-gains treatment or the dividend credit, and the room is usually better spent on bonds, GICs and US dividend payers, whose tax drag is larger. If your current marginal rate is well above your expected retirement rate and you have nothing better to put there, Fairfax in an RRSP is perfectly sensible. Placement depends on what competes for the room RRSP vs TFSA: The Decision Changes as Your Income Rises.
Berkshire pays no dividend, so it has no withholding tax and a lower annual drag than Fairfax in a taxable account. But a non-registered Canadian holding brings administration: Form T1135 reporting if the aggregate cost of specified foreign property outside registered plans exceeds CAD 100,000, currency effects embedded in each capital gain, conversion costs (often 1% to 2% at retail brokers unless you use a workaround such as Norbert’s gambit), and US estate-tax exposure for larger estates, mostly mitigated by the Canada-US treaty. Fairfax has none of these, so in a close call the account details lean slightly toward it.
What Could Go Wrong?
The comfortable version of the story says the cycle is turning gently and the cushion is large. The uncomfortable version is that three tailwinds are fading together: Marsh’s second-quarter 2026 index shows global commercial insurance prices down 6% and property down 12%, the rate regime that quadrupled investment income has probably peaked, and favourable reserve development, 41% of 2025 underwriting profit, depends on a loss environment that may not repeat. At a 98% combined ratio, my stress case, underwriting profit falls from USD 1.8 billion to about USD 0.5 billion, alongside lower reinvestment yields.
Most of these risks are temporary. Catastrophe years, softer pricing, lower rates and an ordinary equity bear market hit earnings rather than capital, and Fairfax’s income and reserve cushions are large. The risks that could cause permanent loss are rarer, and they come from decisions rather than the cycle: a systematic reserve shortfall in long-tail casualty (I found no evidence of aggressive reserving), a return to macro hedging or leverage, or a holding-company liquidity squeeze. On that last point, debt to capital rose to 28% from 26.2% at the end of 2025 while holding-company cash fell to USD 2.3 billion and acquisitions are pending, and the first-half buyback of USD 1.72 billion exceeded the roughly USD 0.6 billion a year of surplus cash the holding company generates after its own costs, so the Poseidon sale paid for it. Eurobank’s weight means Greek banks matter, and a weak succession or family-governance dispute would hit an investment culture historically concentrated in Watsa.
Currency is smaller but surprises Canadians. Book value, earnings and the dividend are in US dollars, and 77% of fixed income is government bonds, largely US Treasuries. If the Canadian dollar strengthens 10%, the Canadian-dollar value of an unchanged US-dollar share price falls about 9%. In 2025 book value per share grew 19% in US dollars but only about 13% in Canadian dollars.
What Price Would Make Fairfax Attractive?
The bands below come from my five-year return model, calibrated to the June 30, 2026 book value of USD 1,304 per share (about CAD 1,860). They must rise as book value does, roughly 10% a year in my base case, so a target anchored today and left alone for two years will be wrong.
| Band | Price (CAD per share) | Price to book | Base-case 5-year return |
|---|---|---|---|
| Exceptional value | Below about 1,670 | Below 0.90x | 18% or more |
| Attractive entry | 1,670 to 1,950 | 0.90x to 1.05x | About 14.5% to 18% |
| Reasonable accumulation | 1,950 to 2,175 | 1.05x to 1.17x | About 12% to 14.5% |
| Fair value | 2,175 to 2,350 | 1.17x to 1.27x | About 10% to 12% |
| Expensive | 2,350 to 2,700 | 1.27x to 1.46x | About 7.5% to 10% |
Source: my calculations; price-to-book bands use the June 30, 2026 book value. Above about CAD 2,700 the price requires bull-case assumptions.
At CAD 2,251 Fairfax is in the fair-value band, which is why I call it a modest buy close to a hold. The base case earns above a reasonable 8% to 10% hurdle, but the bear case roughly returns your money over five years, and it takes a price below about CAD 1,950 for the bear case to earn a decent 4%.
Relative to Berkshire, Fairfax stays the better marginal dollar until about CAD 2,520 and remains close to equal until about CAD 2,745. Neither number is a trigger, but they frame a rule: when Fairfax moves above roughly CAD 2,520 without a matching rise in book value, the next dollar is at best a coin flip and increasingly belongs in Berkshire.
My Fairfax Verdict
Fairfax is a materially better business than the one that disappointed shareholders from 2011 to 2020, and it has been a great investment since 2020. It is a good business today, not a best-in-class one. And at about CAD 2,251 it is an attractive but not compelling stock. Those are three different questions, and only the third affects what you do.
On value, Fairfax is reasonably attractive at 1.21 times book, about 1.06 times adjusted book and 9.5 to 11.8 times normalized earnings, but it isn’t a deep-value bargain. As an income holding it is weak. As a compounder it has good potential, subject to underwriting and capital-allocation discipline I can’t assume. On quality it has improved substantially, though Berkshire remains superior in diversification, balance sheet, underwriting and clarity of succession.
- Would I own Fairfax for the next 10 to 20 years? Yes, as a satellite position, expecting 8% to 10% a year rather than the 22.5% of the recent past. I’d revisit if debt to capital rises meaningfully, if the combined ratio moves above 96%, or if governance changes weaken capital discipline.
- Would I buy it at about CAD 2,250? A modest starting position, yes, with a plan to add on weakness toward CAD 1,950 rather than commit fully now, since an insurer entering a softer market may offer a better entry, though I can’t know that.
- Would I add to Fairfax or Berkshire with the next CAD 5,000, given a 10 to 1 weighting? Fairfax, two shares, with moderate confidence. The modelled return is about 10.4% versus 5.6%, the added risk is small at that weighting, and the account details lean the same way. Berkshire stays the larger core holding, and the case weakens above roughly CAD 2,520 and reverses above about CAD 2,745.
I hold this view loosely. The models carry an error of a couple of percentage points, Berkshire’s is the less reliable, and the third-quarter results expected in late October will move book value and the combined ratio. If you are weighing how a single stock fits next to index funds, start with my Berkshire Hathaway versus index-fund analysis.
This article is general information and my own opinion, not personalized investment, tax or legal advice. Investment models are estimates, not forecasts. Consider your own circumstances or consult a licensed adviser before acting.