
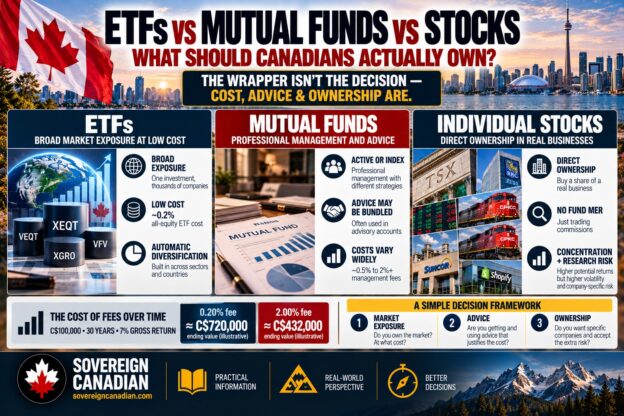
A Canadian who has been investing for fifteen or twenty years and logs into every account at once will often discover that they own all three categories already. There is a balanced mutual fund at the bank, opened when an adviser suggested it and never revisited. There is a one-ticket ETF of the XEQT or VEQT variety, accumulated in the TFSA more recently and with considerably more conviction. And in the non-registered account there are the holdings someone chose on purpose: a Canadian bank or two, Enbridge, CN or CPKC, Brookfield, perhaps Berkshire Hathaway. Each came from a different decision, made at a different time, for a different reason, and most of them have never been compared with each other on any common basis.
The question that follows from that picture is not “which investment type is best?” That framing invites a tournament, and tournaments produce slogans. The more useful question is what job each holding is doing, what it costs, and whether it is earning its place. I own funds, ETFs and individual companies myself, and the purpose of this exercise is not to defend one camp. It is to work out which parts of a portfolio deserve to be paid for, which deserve to be owned directly, and which are simply inherited habits.
The comparison is built wrong
“ETF versus mutual fund versus individual stock” sounds like three options on a menu, but it mixes three different questions. ETF and mutual fund are legal structures: ways of packaging a pool of securities and selling units of it. Passive and active are strategies: whether the pool follows an index or tries to beat one. Owning individual stocks is a degree of portfolio construction: whether you delegate the selection of holdings entirely, or make some of the selections yourself. Those three axes do not line up with each other, and most of the confusion in the conventional debate comes from treating them as if they did.
Separate them and several things fall out. A low-cost index mutual fund is economically almost identical to an index ETF. An actively managed ETF is still active management. A covered-call ETF can be more expensive and more complicated than a plain mutual fund, and pursues a different objective from either. A portfolio of individual stocks can be passive in behaviour if the owner buys businesses they understand and rarely trades, and an ETF portfolio can be wildly active if the owner rotates among thematic funds every quarter. The wrapper tells you how something is held, not what it is, what it costs or whether it suits you.
What an investor actually buys, in my view, is a bundle of three separate things: market exposure, advice, and ownership. Market exposure is the return of some collection of businesses. Advice is a service: planning, tax work, behavioural coaching, a person to call before selling in a panic. Ownership is the deliberate choice to hold particular companies, with all the engagement and concentration that implies. Some products sell all three at a single price. Others sell exposure alone. The discipline worth adopting is to price each one separately, see what you are paying, and decide whether each is worth it.
What market exposure costs now
Broad market exposure has become extraordinarily cheap, and it has become cheaper recently enough that a lot of published figures are stale. The iShares Core S&P/TSX Capped Composite Index ETF (XIC) carries a management fee of 0.05% and a reported MER of 0.06% and holds more than 200 Canadian companies. Vanguard cut the management fee on its asset allocation ETFs from 0.22% to 0.17% in November 2025; VEQT’s page currently shows a 0.17% management fee and a reported MER of 0.22% on roughly C$17 billion of assets. BlackRock’s XEQT charges a 0.17% management fee and currently reports a 0.19% MER.
The gap between “management fee” and “MER” explains why figures from different websites disagree. The management fee is what the manager charges now; the MER is an accounting result, total expenses including operating costs and applicable taxes divided by average assets over the reporting period, so a recent fee cut may show up only partly. VEQT’s reported MER should eventually reflect more of the November 2025 reduction, though the eventual figure is not something I would predict precisely. Use the management fee for what a fund charges today, the latest MER for what the fund has actually reported, and be suspicious of any comparison tool that does not show its date.
The spread among the major all-equity allocation ETFs is a few basis points, which on C$100,000 is a few dollars a month. What matters is the order of magnitude: a portfolio of thousands of securities across the world now costs roughly two-tenths of one percent a year, and a plain Canadian index ETF costs less than a tenth of one percent.
Stated cost and realized cost are not identical. An index ETF’s return can differ from its benchmark by somewhat more or less than its stated MER because of trading, taxes, cash flows, securities lending and other implementation effects. A favourable tracking history is useful evidence that a fund has been run efficiently. It is not a promise about the next decade.
| Product | What it is | Management fee | Reported MER |
|---|---|---|---|
| XIC | Broad Canadian equity index ETF | 0.05% | 0.06% |
| VEQT | All-equity allocation ETF | 0.17% | 0.22% |
| XEQT | All-equity allocation ETF | 0.17% | 0.19% |
| TD Canadian Index e-Series | Index mutual fund | — | 0.22% |
| RBC Select Balanced Portfolio, Series A | Commission-based balanced fund | 1.67% | 1.94% |
| RBC Select Choices Balanced Portfolio, Series A | Commission-based balanced fund | — | 2.13% |
| RBC F-series funds | Fee-based versions of RBC funds | varies | varies by fund |
| Mawer Balanced | No-trailer active balanced fund | — | 0.92% |
| BMO Canadian High Dividend Covered Call ETF (ZWC) | Active covered-call ETF | 0.65% | 0.72% |
Fees are based on the latest issuer information available when this article was prepared in 2026 and can change. Check the issuer before making an investment decision. Products in the table pursue different strategies, so this is a comparison of cost structures rather than expected returns.
The famous 2% mutual fund
The table makes it awkward to say that Canadian mutual funds cost two percent, and I would avoid saying it. The answer varies enormously by how the fund is sold. Commission-based Series A units of some balanced funds sold through traditional advice channels still sit around 2%, as the RBC examples show. Fee-based F-series funds can be materially cheaper at the fund level, independent managers such as Mawer charge around 0.9% for a balanced fund with no trailing commission, and the TD Canadian Index e-Series fund had an MER of just 0.22% as of June 30, 2026.
Series A costs around two percent in part because the price bundles several things. RBC Select Balanced Series A, for example, has a 1.67% management fee and a 1.94% MER, and RBC’s Fund Facts discloses an annual trailing commission equal to 1.00% of the value of the investment, paid out of the management fee to the dealer for services and advice. That leaves roughly two-thirds of a percentage point of the management fee for the manager before the other expenses that take the total MER to 1.94%.
That decomposition changes the question. Comparing a 1.94% Series A fund with a 0.20% ETF and stopping there is not entirely fair, because the first price includes a service and the second does not. But the reverse mistake is also available: treating bundled advice as free, or as self-evidently worth a point a year, because it arrives inside a fund price and never appears as a bill. There are two purchases here, and each can be examined on its own. What is the portfolio management worth against a 0.2% alternative? And what is the advice worth against what the same services would cost bought directly?
Unbundling is the obvious response, and it mainly improves visibility. A fee-based adviser who charges 1% and implements the portfolio with F-series funds approaching another 1% can still leave the client paying something close to 2% a year before applicable tax on the advisory fee. The price has simply been divided into two lines that can be inspected. A fee-based adviser who uses 0.2% ETFs produces a very different arrangement, roughly 1.2% to 1.3% all-in once applicable sales tax on the advisory fee is included. That is still many times the DIY product cost, but it has a defensible logic: the portfolio exposure is cheap and most of the remaining price is visibly being paid for advice.
Regulation has been moving the same way. Deferred sales charges were banned for new mutual fund sales across Canada effective June 1, 2022, including Ontario. Trailing commissions can no longer be paid to order-execution-only dealers. And Total Cost Reporting took effect on January 1, 2026. Dealers are required to incorporate the enhanced information into annual fee and charge reports for the year ending December 31, 2026, meaning Canadian investors begin seeing the expanded information in their annual reports in 2027.
Anyone with a long-standing adviser should expect that new line to prompt a conversation, and might start it first.
What fees do to a compounding portfolio
The table below shows C$100,000 growing at an illustrative 7% gross return, with each fee subtracted from the return every year, which is the same as charging the fee on the opening balance. The 7% is a convenient assumption, not a forecast. Subtracting the fee is a standard shorthand. Deducting it instead as a fraction of each year’s grown balance, which is arguably closer to how a daily-accrued fund fee behaves, makes the gap somewhat larger: about C$113,000 rather than C$107,000 over twenty years for 2.00% against 0.20%. The figures below, if anything, understate the effect.
| Annual fee | After 10 years | After 20 years | After 30 years |
|---|---|---|---|
| 0.20% | C$193,069 | C$372,756 | C$719,677 |
| 1.00% | C$179,085 | C$320,714 | C$574,349 |
| 2.00% | C$162,889 | C$265,330 | C$432,194 |
Illustration: C$100,000 at a 7% gross annual return, fee subtracted from return each year, no contributions, no taxes.
After twenty years the investor paying 2.00% has about C$107,000 less than the investor paying 0.20%. It would be easy to describe that as the cost of the fees, and that would be wrong. The 2.00% fund deducted about C$66,000 in fees over those twenty years, against about C$8,000 for the 0.20% fund, so the additional fees amount to roughly C$58,000. The remaining C$49,000 or so is something else: the growth those extra fee dollars would have earned had they stayed invested. The ending-wealth difference is the sum of the two, and three different quantities are in play: the fees the fund actually deducted, the extra fees relative to the cheaper alternative, and the foregone growth on those extra fees.
| Horizon | Fees deducted by the 2.00% fund | Extra fees versus the 0.20% fund | Growth those extra fees would have earned | Ending-wealth gap |
|---|---|---|---|---|
| 10 years | about C$25,200 | about C$22,400 | about C$7,800 | about C$30,200 |
| 20 years | about C$66,100 | about C$58,100 | about C$49,300 | about C$107,400 |
| 30 years | about C$132,900 | about C$114,700 | about C$172,800 | about C$287,500 |
Same illustration, rounded to the nearest C$100. Extra fees plus foregone growth equals the ending-wealth gap.
The proportions shift with time. At ten years the foregone growth is a small part of the gap; at thirty years it is larger than the extra fees themselves. That is the real argument for paying attention to cost: fees are one component of investment results you know in advance, and their effect compounds against you.
The same arithmetic gives a hurdle rate. To leave an investor equally well off, a fund charging 2.00% has to beat a 0.20% alternative by roughly 1.8 percentage points a year before fees, consistently enough to overcome the difference. For a fund charging about 0.9%, the hurdle is closer to 0.7%. Whether managers have historically cleared those hurdles is an empirical question, and Canada has a well-maintained scoreboard.
Does active management earn the difference?
S&P’s SPIVA Canada scorecard compares Canadian actively managed funds with category-appropriate benchmarks, and its year-end 2025 report makes difficult reading for active funds. Over ten years, 98.8% of Canadian equity funds failed to beat their benchmarks. Underperformance was similarly widespread across Canadian focused equity, dividend and income, U.S., international and global equity categories. Canadian Dividend & Income funds had a much better single year in 2025, but their long-term record was substantially weaker.
Survivorship is part of the story rather than a footnote. Funds close and merge, and evaluating only the survivors gives investors a rosier picture of the starting universe than they actually faced.
It would be too fast to stop there, and it would be wrong to read the result as saying that managers have no skill. SPIVA measures what fund investors received, not what managers could do before costs. It compares fund returns, net of management and operating costs, with index returns that do not themselves represent the full cost of owning an investable index product. In the retail Canadian market, part of the fund universe also carries distribution and advice costs. A fair statement is that SPIVA is not a pure laboratory test of manager skill.
The distinction I would hold on to is between skill and delivered return. Berk and van Binsbergen’s study of nearly 6,000 U.S. mutual funds concluded that managers can create value, and that skill can persist, while also arguing that competition allows managers to capture much of that value through compensation. A manager can possess real skill and still fail to deliver enough of it to the person who owns the fund. For the investor, the net figure is the one that arrives in the account.
That is why the SPIVA gap matters even to someone who believes skilled managers exist, and why the question of fees keeps returning: they stand between whatever skill the manager possesses and the return the investor receives.
The harder problem is choosing the winner beforehand
The more defensible claim is a narrower one. Whatever skill exists among managers, investors have historically had great difficulty identifying in advance the ones who will deliver benchmark-beating returns after costs.
Knowing that some managers beat the market is not enough to justify paying for one; the investor has to choose before the outperformance, using only information available at the time. Canadian persistence studies have occasionally found periods in which past winners persisted more often than chance would suggest, but that result has not been reliably durable. Other periods have shown very little persistence at all.
The American record points the same way with more force. Morningstar’s mid-2026 Active/Passive Barometer found that only 25% of active strategies both survived and beat their passive counterparts over the ten years through June 2026. Cost mattered substantially: 33% of active funds in the cheapest fee quintile beat their average passive peer over that decade, compared with 20% in the most expensive quintile.
Low cost improves the odds, which is a long way from identifying winners.
Mawer is a useful Canadian case study precisely because it is not a straw man. It is the kind of manager a careful, sceptical investor might rationally have chosen: respected, with a long record and a coherent process, and priced far below the traditional 2% retail mutual fund. The Mawer Balanced Fund reported an MER of 0.92% as of June 30, 2026. At that date its net returns were 10.5% over one year, 10.9% annualized over three years, 5.7% over five and 6.9% over ten, against 21.4%, 15.8%, 9.0% and 8.6% respectively for Mawer’s internal balanced benchmark.
Those figures do not show that Mawer is a bad manager, and that is precisely the point. A respected, reasonably priced active manager can go through a long period in which its reported return trails its chosen benchmark. That may reflect style, positioning, valuation discipline, market conditions or simply the difficulty of outperforming after costs. A long and distinguished record is useful information. It does not settle what happens next.
Why anyone should still own individual stocks
The research above is often read as an argument that no one should own individual companies. I do not think it supports that conclusion.
There are several reasons I would call rational. You may want deliberate exposure to businesses you have studied and think you understand. You may want to exclude companies you would prefer not to own, which a broad fund cannot easily accommodate. You may value more granular control over which positions you sell and when, including position-by-position loss harvesting. You may like having no ongoing fund fee. You may simply find the work engaging, which is not a trivial benefit for someone who will otherwise ignore their portfolio. And there is the possibility, never to be ruled out, of genuine alpha.
Two items on that list sound especially financial, and both are easy to overstate.
The first is the fund fee. A direct portfolio has none, which against a broad Canadian index ETF means avoiding something like six basis points a year. That is not the whole ledger, because a direct portfolio has costs of its own: a per-trade commission at some brokerages and none at others, bid-ask spreads, currency conversion on U.S. stocks, and the time it takes to administer many positions, each with its own cost base and dividends.
The second is tax, and here “more granular control” is more accurate than “more efficient.” Each purchase is part of an adjusted cost base calculation, and a direct holder can choose which positions to sell, realize a gain or a loss in a particular year, and harvest losses position by position, whereas a broad ETF is a single holding. An ETF holder also decides when to sell and can potentially harvest a loss by switching to a sufficiently different fund. What the direct holder can avoid is the possibility that the fund itself distributes taxable gains the holder did not personally choose to realize.
What the direct holder gives up is diversification inside the account, which is the cost that never appears on a statement.
Whether the fee and tax differences add up to something material depends on how much the ETF distributes, the investor’s realized gains elsewhere, their tax bracket, trading and currency costs, and the number and size of the positions. Loss harvesting also often defers tax rather than permanently eliminating it. Portfolio size changes the arithmetic mainly by making small percentage savings worth more dollars and shrinking fixed trading costs as a percentage of assets. It does not reduce concentration, research or behavioural risk.
It follows that saving the ETF’s MER is not, by itself, a compelling reason to own individual stocks. Six basis points does not compensate for materially greater concentration and the wider menu of behavioural errors a direct portfolio opens up. If the case rests on the merits of a business you can describe, the tax features are a modest bonus and the fee saving is noise. If it rests on the fee saving, it is not a case.
What the stock-picking evidence actually says
The standard citation is Barber and Odean’s study of 66,465 U.S. households from 1991 to 1996. The average household earned 16.4% a year net of costs against 17.9% for the market; the most active traders earned 11.4% and the least active 18.5%, slightly more than the market. The authors attributed much of the penalty to the cost and frequency of trading and linked the trading behaviour to overconfidence.
Evidence from the zero-commission era is no friendlier to frequent traders. Research into concentrated buying by Robinhood users found that intense attention-driven buying tended to be followed by poor short-term returns.
These studies are strong evidence against frequent trading and attention-driven buying. They are much weaker evidence against a disciplined investor who buys twenty or thirty businesses and holds them for years, who is barely represented by the behaviour being criticized. There is a vital difference between “some investors can outperform” and “I can know in advance that I am one of them.” The evidence supports the first proposition and gives an individual investor very little confidence about the second.
The Bessembinder research is the other piece often misquoted. In his study of nearly 26,000 U.S. stocks from 1926 to 2016, delisted companies included, about 42.6% beat one-month Treasury bills over their full listed lives, which means most did not. In dollar terms the picture was more extreme: the best-performing four per cent of firms accounted for all the net wealth created above T-bill returns, while the remaining 96% collectively matched Treasury bills. Later global research found similarly concentrated wealth creation.
The result does not say that only four per cent of stocks make money. Many produce positive returns while still failing to beat the risk-free alternative.
The implication runs two ways. An index owns the extreme winners automatically. A concentrated investor who holds one can do spectacularly well, which is why stock selection has never gone away. But the existence of rare, enormous winners makes the hurdle higher than “avoid the bad companies.” Twenty reasonable businesses have to include, or at least not miss too much exposure to, the relatively small group that generates an outsized share of aggregate gains.
That does not prove a twenty-stock portfolio cannot beat the market. It means doing so requires something more than simply avoiding obviously bad businesses.
Is twenty stocks diversified?
The older diversification literature, from Evans and Archer in 1968 to Statman in 1987, is usually summarized as “twenty to thirty stocks is enough.” What it measured was largely the reduction in firm-specific volatility in randomly selected portfolios. Twenty reasonably chosen companies can remove a great deal of company-specific risk. They do not necessarily make a portfolio market-like.
Diversification across sectors, countries, currencies and economic exposures is not simply a question of stock count.
Canada makes the distinction concrete. The S&P/TSX Composite is itself concentrated relative to a truly global portfolio, particularly in financials, energy and materials. A stock portfolio built from the best-known Canadian dividend names can concentrate those exposures further.
The familiar do-it-yourself Canadian dividend portfolio makes the problem easy to see. Take five banks and a couple of insurers, three pipelines, a few telecoms, two utilities, the railways and a grocer or two. That is twenty tickers and it looks diversified.
Economically, though, many of the positions are exposed to overlapping forces: the Canadian economy, interest rates and credit conditions, domestic regulation, housing, energy infrastructure, the Canadian dollar and Canadian consumers. There is relatively little technology or health care and much less international diversification than the ticker count suggests.
A stylized calculation shows how much common exposure matters. Take twenty stocks that each have 30% annual volatility. If the average correlation between them is 0.3, portfolio volatility is roughly 17%; if it is 0.6, it is roughly 24%. Adding still more highly correlated stocks eventually does relatively little to remove the common risk. Those numbers are an illustration rather than measurements of an actual Canadian dividend portfolio, but the principle is important.
An investor can be diversified across companies and concentrated across exposures, and in Canada the second condition is easy to miss precisely because the first is so visible.
Such a portfolio is not necessarily a bad one. It is a concentrated bet on Canadian income-oriented businesses, and should be understood as such and held alongside something that supplies the exposures it lacks.
Taxes: real, but don’t let the tax tail wag the portfolio
For a taxable account, the tax features of the three structures genuinely differ, though less than is often claimed.
Canada’s capital gains inclusion rate remains 50%. The federal government announced in March 2025 that it would not proceed with the proposed increase, and the CRA reverted to administering the existing one-half inclusion rate.
Direct holders have more granular control because they can choose which positions to sell and harvest losses position by position, but ETF investors also choose when to sell, so control over realization is not exclusive to stock owners. ETFs and mutual funds can also distribute income and capital gains the owner did not personally choose to realize. Reinvested distributions can create taxable income even though no cash arrives in the investor’s account, and the corresponding amount generally has to be reflected in adjusted cost base to prevent double taxation later. Return of capital works in the other direction by reducing adjusted cost base.
The CRA’s superficial-loss rule constrains harvesting. A superficial loss can occur when you or an affiliated person acquire the same or identical property during the period beginning 30 calendar days before the sale and ending 30 days after it, and the substituted property is still owned at the end of that period. Spouses and common-law partners are among the affiliated persons identified by CRA.
The general rule normally allows a denied superficial loss to be added to the adjusted cost base of substituted property when the appropriate taxpayer owns that property, but registered accounts require particular care because there may be no taxable cost base to which a denied loss can usefully be added. Selling an investment at a loss in a taxable account and immediately repurchasing the same investment in a registered account is therefore a tax-loss-harvesting trap rather than a clever workaround.
One persistent myth should also be set aside. Donating appreciated securities in kind to a registered charity can bring the capital-gains inclusion rate on the donated property to zero, subject to the rules. According to the CRA, the eligible property includes publicly traded shares as well as units of a mutual fund trust and shares of a mutual fund corporation.
It is a good reason to consider donating appreciated securities rather than selling them and donating cash. It is not a reason to prefer individual stocks over funds.
Foreign withholding tax, in proportion
The foreign withholding tax rules are intricate, but a working understanding takes only a few paragraphs.
Under the Canada–U.S. tax treaty, qualifying pension and retirement arrangements receive special treatment. U.S. dividends paid directly into an RRSP or RRIF through U.S.-listed securities can generally receive the treaty exemption from U.S. withholding. A TFSA does not receive the same pension-plan exemption, so the normal 15% treaty withholding on U.S. dividends is generally a permanent cost inside the account.
An FHSA should not be assumed to receive an RRSP-style exemption either. The CRA now expressly notes that dividend income from a foreign country paid into an FHSA can be subject to foreign withholding tax.
In a taxable account, foreign tax paid can generally be relevant to Canada’s foreign-tax-credit system, subject to the applicable rules and limitations.
Fund structure matters too. A Canadian-listed ETF holding U.S. stocks is itself the investor receiving the U.S. dividends, so putting the Canadian ETF inside an RRSP does not simply turn its underlying U.S. holdings into securities owned directly by a retirement arrangement. Some Canadian ETF structures that hold other foreign funds can introduce additional layers of withholding. This is why some investors with substantial RRSP balances use U.S.-listed ETFs for certain foreign exposures.
How much does it matter? Usually less than the complexity of the subject makes it sound.
A simple illustration shows the scale. On C$200,000 of U.S. equities inside an RRSP yielding 1.2%, a 15% withholding tax on those dividends is about C$360 a year. Avoiding that amount can be worthwhile if the U.S.-listed structure is otherwise appropriate and currency conversion is inexpensive. It is much less compelling if converting C$200,000 to U.S. dollars costs 1.5%, or roughly C$3,000, and the investor repeatedly incurs conversion costs when adding money.
That does not produce a magic portfolio threshold. It is a reason to run the arithmetic with your own yield, ETF structure, brokerage costs and account size. Withholding is also only one input into asset location. Expected return, the tax character of income, available registered room, diversification and what would otherwise occupy the account matter too.
U.S.-listed securities also bring estate and compliance considerations that Canadian-listed ETFs avoid. U.S. shares and U.S.-listed ETFs can be U.S.-situs property for estate-tax purposes. The estate-tax rules for Canadian residents are moderated by the Canada–U.S. treaty and are substantially more nuanced than simply applying the low domestic exemption available to nonresident non-citizens. For most Canadians this is more likely to be a filing and planning issue than an actual U.S. estate-tax liability, but substantial U.S.-situs holdings combined with a large worldwide estate warrant professional cross-border advice.
Foreign-property reporting is more straightforward. If the total cost amount of a Canadian resident’s specified foreign property exceeds C$100,000 at any time during the year, Form T1135 may be required. Registered-plan property is excluded. CRA also explicitly confirms that an investment in a Canadian mutual fund trust is not specified foreign property for the investor, even when the Canadian fund itself owns foreign investments.
That makes a Canadian-listed ETF holding foreign securities different for T1135 purposes from owning the foreign securities or a foreign-listed ETF directly in a taxable account.
Behaviour matters more than the wrapper
On average, investors earn less than the funds they hold report because the timing and size of their purchases and sales differ from a simple buy-and-hold investment.
Morningstar’s 2026 Mind the Gap study, which is American and should be read as such, estimated that the average dollar invested in U.S. mutual funds and ETFs earned 8.7% a year over the ten years ended December 31, 2025, against a 9.9% aggregate annual total return for the funds themselves. The gap was roughly 1.2 percentage points a year.
ETF investors actually showed a wider timing gap than investors in open-end mutual funds: about 1.6 percentage points annually versus 1.2. That does not mean ETFs cause bad behaviour. Morningstar found large differences among asset classes and product types, and volatile or fashionable exposures give investors more opportunities to mistime purchases and sales.
The lesson is that the wrapper explains little by itself.
My own inference, which is not a finding of the Morningstar study, is that a diversified holding with little reason to tinker, such as a plain one-ticket ETF held for thirty years, may beat a theoretically superior portfolio that its owner constantly alters, and that this has little to do with fees.
There is a possible converse that I would also label as an inference rather than research. Someone who has actually read the annual reports of CN, CPKC or Brookfield, and who owns them because they believe in the businesses, may hold through a drawdown more steadily than they would hold a portfolio of tickers they do not understand. A modest direct-stock sleeve might therefore be behaviourally healthy for such an investor.
I found no good evidence for or against that proposition. Your own transaction history will show whether it holds for you.
What advice is worth
Advisers are sometimes dismissed with more confidence than the evidence supports.
One of the strongest Canadian studies is Foerster, Linnainmaa, Melzer and Previtero’s analysis of roughly 5,900 advisers and 580,000 clients, later published in the Journal of Finance. Advisers moved clients into riskier portfolios, which raised expected returns, but offered relatively little customization: an adviser’s own allocation predicted clients’ portfolios surprisingly well. Advised portfolios also carried materially higher costs.
The study does not show that advice is worthless. It did not capture every potential source of planning value, including tax planning, withdrawal sequencing, CPP and OAS decisions, estate coordination, insurance or the value of persuading someone to save and remain invested. Its underlying data are also older.
The more useful reading is that investment selection alone is a difficult service on which to justify a large recurring fee. Financial planning and behavioural advice may create substantial value, but the investor should know whether they are actually receiving those services.
The pricing argument follows from that. On C$500,000, a 1% asset-based fee is C$5,000 a year before applicable sales tax, and on C$1 million it is C$10,000. The right question is what you receive for that sum each year.
Someone who needs an occasional retirement plan, pension decision or estate review may find a flat-fee or hourly planner considerably cheaper. Someone who genuinely uses continuous coordination across tax, withdrawals, insurance and family, and who would otherwise fail to implement the plan, may find an asset-based adviser worth the price.
That behavioural coaching can be valuable does not make it worth a percentage of assets every year. The test is whether the advice changes decisions that matter, and whether the value created is reasonable relative to what it costs.
Neither arrangement is a failure. Paying for a service you use is sensible. Paying a recurring percentage for a service you rarely use is the part worth reconsidering.
There is also a continuum between doing everything yourself and paying for full-service advice. A one-ticket ETF costs roughly 0.2% at the product level. Robo-advisers add a management fee in exchange for portfolio construction, implementation and rebalancing. Full-service advisers can add another percentage point or more. Traditional mutual-fund arrangements may bundle much of the cost into the product itself.
The important distinction is not DIY versus adviser. It is whether the services and their prices are visible enough that you can decide what you are actually buying.
The covered-call ETF as exhibit
A short example shows how little the letters ETF say.
The BMO Canadian High Dividend Covered Call ETF, ZWC, charges materially more than a plain broad-market index ETF. It is an actively managed fund that holds dividend-paying Canadian companies and sells call options on part of the portfolio.
In exchange for option premium, it gives up some of the upside if those shares rise sharply. Its distributions can include dividends, option-related income and, depending on the year, return of capital.
A distribution yield is not a return, and a fund that distributes a great deal is not thereby earning a great deal.
Whether that exchange of potential upside for current cash flow is attractive depends on what an investor needs. Some investors deliberately want an income-oriented strategy of this kind.
The point is narrower: an active, income-oriented covered-call product wears the same ETF label as a 0.06% Canadian index fund.
The letters ETF do not tell you whether a fund is cheap, passive, broadly diversified or built to maximize long-term growth.
A core, a satellite, and tests instead of a ratio
Putting this together leads to the familiar core-and-satellite arrangement, though I want to resist the usual version, which attaches a ratio.
There is no research that supports a universal satellite size. The ratios one sees, 70/30 or 80/20, are conventions, and I would rather offer tests.
The core is a diversified, automated holding that does the heavy lifting and can be rebalanced with very little thought. The satellite is where an investor can own businesses, pursue convictions, learn or simply enjoy investing.
The first test is whether, if the satellite fell by half, your retirement date or lifestyle would change. A satellite that is 10% of the portfolio and loses half costs 5% of the total, which a plan with reasonable margins should be able to absorb.
The second is whether the likely contribution is worth the effort. A 10% sleeve producing two percentage points of excess return a year, an excellent result, adds only 0.2 percentage points to the return of the whole portfolio.
The third is whether you can tolerate several years of lagging the benchmark. Even respected professional managers go through such periods.
The fourth is whether the core remains genuinely diversified.
The fifth is whether a rule stops the satellite quietly becoming the portfolio, such as an annual trim back toward a band chosen in advance.
If you do own a satellite, measure it properly. A rising balance in a bull market is not evidence of skill. The cleanest comparison is the stock sleeve against the ETF that would otherwise have occupied it, using the same dates for every deposit and withdrawal, with dividends and currency included. A money-weighted calculation such as XIRR can be useful for measuring the investor’s actual experience.
If the sleeve is 50% Canadian, 35% U.S. and 15% international, the S&P 500 alone is the wrong benchmark. In a taxable account, taxes matter too.
The result will not always flatter, but it will inform.
What I would actually do
The answer depends on which of the three things you are buying, and I would rather be plain than hedge.
Starting from scratch, for a Canadian who wants market exposure and does not particularly enjoy investing, the default is a diversified low-cost ETF or a genuinely low-cost index fund. An all-in-one allocation ETF is very hard to beat for simplicity: the cost is on the order of a fifth of one percent, the diversification is global, and the rebalancing takes care of itself.
It is a default in the sense that a person should have a reason to depart from it, not because every departure is a mistake.
If you need advice, buy it deliberately. Know what it costs in dollars and whether you are buying portfolio management, financial planning, tax planning, behavioural coaching or all of them. Do not assume a 2% fund is justified because it comes with advice, and do not assume a 1% adviser is cheap because the fund underneath costs 0.2%.
If you enjoy owning individual businesses, own some, benchmark them properly, count dividends, currency and taxes, and size the sleeve so being wrong does not compromise your financial independence. If the reason for owning a company is that you understand and believe in it, that is a reason. If the reason is the saved MER, it is not.
If you already hold expensive mutual funds, do not sell everything tomorrow. Find out the series and MER, the embedded compensation, which accounts the funds sit in, the unrealized gains in any taxable account, what the adviser actually does for you, and what switching would trigger.
Selling an investment inside an RRSP or TFSA does not by itself create an immediate taxable capital gain; selling appreciated investments in a taxable account can.
Total Cost Reporting will make more of the fund-cost information visible in investors’ annual reports beginning in 2027. Then decide whether the arrangement earns its cost. For some people it will and for many it will not, but the decision should rest on a number and a list of services, not on inertia.
This is where the Sovereign Canadian approach lands.
Own productive assets. Minimize unnecessary friction. Understand what you own. Pay for value when value is actually being delivered.
A broad ETF is a rational default under that rule because the exposure is cheap and the friction is low, not because the letters ETF carry any virtue. The cheapest investment is not automatically the best, and the most expensive is certainly not automatically the best.
What is worth doing is looking at each holding, knowing what it is for, and being able to say what you are paying and what you are getting in return.