
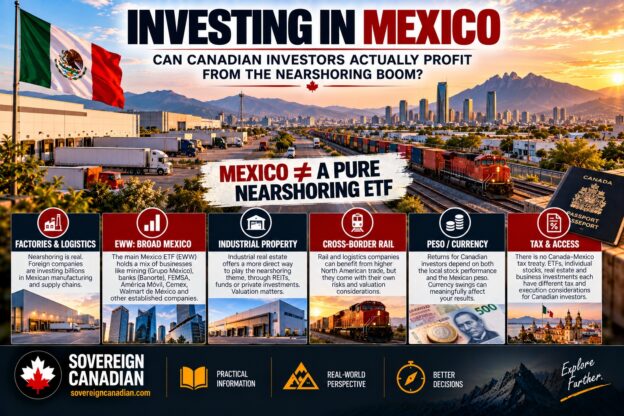
Mexico’s factories are real. I’m not going to argue otherwise. Foreign companies put a record USD 40.9 billion of direct investment into Mexico in 2025, and another USD 35.0 billion in the first half of 2026. Trucks, rail cars and containers cross the border every hour carrying cars, servers and appliances that were assembled in Mexico and sold to Americans.
The question I care about is different. If Mexico wins the nearshoring race, who gets paid, and can a Canadian investor own any of it at a sensible price?
I went looking for the answer the way I did with Vietnam. In that article, an economy growing at roughly 8% a year had delivered about 3% a year to the foreign investor who bought the obvious ETF. Mexico looked like it might be the same story with a different flag.
It isn’t.
It’s closer to the reverse: a slow-growing economy, a stock market that has paid foreign investors respectably, and an investable market that looks surprisingly different from the factories everyone associates with Mexico.
Here’s what the evidence says, what it can’t say, and what I’d do with it.
The Factories Are Real. But the FDI Number Isn’t a Factory Counter.
Start with the headline number.
Mexico’s Secretaría de Economía reported record foreign direct investment of USD 40.871 billion for 2025.
For the first half of 2026, it reported another record: USD 34.968 billion.
That sounds like a flood of new factories. The composition tells a different story.
Foreign direct investment has three main components. New investment is capital entering new or expanded investments. Reinvested earnings are profits that foreign-owned Mexican businesses earned and retained rather than distributing abroad. Intercompany accounts cover financing and transfers between related companies.
| Period | Total FDI | New investment | Reinvested earnings | Intercompany |
|---|---|---|---|---|
| 2024 | USD 36.9 billion | USD 3.2 billion (9%) | USD 28.7 billion (78%) | USD 5.0 billion (14%) |
| 2025 | USD 40.9 billion | USD 7.4 billion (18%) | USD 27.7 billion (68%) | USD 5.8 billion (14%) |
| First half 2026 | USD 35.0 billion | USD 2.7 billion (7.8%) | USD 31.0 billion (88.5%) | USD 1.3 billion (3.7%) |
The first-half 2026 figures are now directly confirmed by the Economy Ministry: USD 30.957 billion of reinvested earnings, USD 2.726 billion of new investment and USD 1.285 billion of intercompany accounts.
Two things stand out.
First, 88.5% of first-half 2026 FDI was reinvested earnings.
Second, that isn’t entirely new. Reinvested earnings were already 78% of the 2024 total. And the story isn’t simply that new investment is disappearing: new investment actually jumped 132.9% in 2025, from USD 3.168 billion to USD 7.378 billion, before falling back to 7.8% of the total in the first half of 2026.
So the fair reading is not “the boom is fake.”
It’s that the headline FDI number can’t be read as a count of new factories.
A large part of it is businesses already operating in Mexico retaining profits there. Those businesses include manufacturers, but also banks, insurers and other foreign-owned companies. In fact, manufacturing accounted for USD 13.482 billion, or 38.6%, of first-half 2026 FDI.
That’s still a lot of manufacturing investment.
It’s just a very different number from USD 35 billion.
Where an export dollar actually goes
The best evidence I found on where the value is created comes from INEGI, Mexico’s statistics agency.
In 2024, Mexican domestic value added represented 44.2% of the value of manufacturing production for global export.
Turn that around and roughly 55.8% represented imported content.
INEGI breaks the domestic portion down further. About 14.8 percentage points came from Mexican-supplied inputs, while roughly 29.4 points were gross value added generated in the exporting activity itself.
Put approximately, for every USD 1 billion of manufactured export production:
- about USD 558 million represents imported content;
- about USD 148 million represents Mexican-supplied inputs; and
- about USD 294 million is value added in the exporting activity itself.
That last bucket includes things like wages, profits and taxes. It does not tell us how much ultimately accrues to Mexican shareholders rather than workers, government or foreign owners.
That’s an important limitation.
I couldn’t find a current official figure showing exactly what share of Mexican manufactured exports is produced by foreign-controlled companies, let alone what portion of the operating profit ultimately accrues to Mexican-listed shareholders.
So I wouldn’t say Mexican shareholders get “almost none” of the value.
What I can say is that a large part of the export machine uses imported inputs, while much of the manufacturing capacity itself belongs to foreign multinationals. The obvious beneficiaries therefore include Mexican workers, Mexican suppliers, industrial landlords, railways, utilities and banks — but also the foreign companies that own many of the factories.
That distinction is going to matter once we open the ETF.
The Economy Underneath
If nearshoring were lifting the whole Mexican economy into a Vietnam-style growth trajectory, you’d expect to see it in GDP.
You don’t.
Mexico’s economy grew just 0.8% in 2025 on INEGI’s seasonally adjusted series. The original, unadjusted series produced a 0.6% figure, which is why both numbers appear in reporting.
Either way, it was a weak year.
The picture improved in 2026. INEGI’s revised data show GDP contracting 0.3% in the first quarter before rebounding 1.4% quarter over quarter in the second.
For the first half as a whole, GDP was roughly 1.2% higher than a year earlier.
There was also a temporary World Cup effect. Banco BASE estimated that roughly two-thirds of the preliminary second-quarter rebound was related to World Cup activity, although that is an economist’s estimate rather than an INEGI decomposition.
Zoom out further and the point gets clearer. Mexico’s economy has grown at roughly 2% a year over the three decades since NAFTA.
That’s the first surprise.
The country at the centre of one of the world’s most important manufacturing shifts still grows more like a mature economy than an Asian emerging-market boomtown.
And that sets Mexico up as an interesting counterpoint not just to Vietnam, but to Japan, where I found another version of the same lesson: the economic story, currency story and investable stock-market story are related, but they aren’t interchangeable.
What an announcement looks like
Tesla’s planned Nuevo León gigafactory is a useful example of the gap between announced investment and deployed capital.
Tesla announced the Santa Catarina project near Monterrey in 2023. Estimates attached to the project ranged from more than USD 5 billion to much larger figures once potential supplier investment was included.
In July 2024, Elon Musk said the project was paused amid uncertainty about future US tariffs. State infrastructure work associated with the site was later halted.
By 2026, Mexican press reports described the site as largely idle.
I found no reliable figure showing billions of dollars of Tesla factory investment actually deployed there.
One project doesn’t establish a national failure rate.
It does establish why I wouldn’t add up press releases announcing future factories and call the total “nearshoring investment.”
What a Mexico ETF Actually Owns
Now the part I think matters most for a Canadian investor.
If you buy a Mexico ETF to play nearshoring, what are you actually buying?
The iShares MSCI Mexico ETF (EWW) is the longstanding US-listed option. At June 30, 2026, its top ten positions represented 63.65% of the portfolio.
Here’s what those positions actually looked like:
| EWW top holding | Weight, June 30, 2026 | What it’s mainly exposed to |
|---|---|---|
| Grupo México | 13.86% | Mostly copper mining, plus rail |
| Banorte | 10.50% | Mexican banking |
| FEMSA | 8.89% | Convenience retail and beverages |
| América Móvil | 8.58% | Telecom across Latin America |
| Cemex | 4.49% | Cement and construction materials |
| Walmart de México | 4.22% | Mexican retail |
| Grupo Aeroportuario del Pacífico | 4.15% | Airports |
| Peñoles | 3.61% | Silver, gold and other metals |
| Arca Continental | 2.84% | Beverages |
| Grupo Aeroportuario del Sureste | 2.51% | Airports, including Cancún |
The biggest position deserves a closer look.
Grupo México is one of the world’s major copper producers. In the second quarter of 2026, its net profit jumped nearly 79% to USD 2.20 billion while copper production actually fell 3.7%. Copper prices had risen about 30.5% year over year.
That’s a pretty good clue about what was driving the business.
Grupo México does own an important railway operation through GMXT, and that is directly relevant to North American integration. GMXT reports 10,570 kilometres of railway across 24 Mexican states, connections at five US-Mexico border points, and 2025 revenue of USD 3.37 billion with EBITDA of USD 1.408 billion.
But buying Grupo México is still primarily buying a mining conglomerate with a significant transportation business, not a pure nearshoring railway.
So how much direct nearshoring exposure is inside EWW?
I don’t think the evidence supports pretending there’s an exact answer.
My estimate from the identifiable industrial-property holdings and the transportation portion of Grupo México is low single digits.
If you broaden “nearshoring exposure” to include banks, airports and construction materials, you can make the number much larger. But at that point you’re increasingly measuring exposure to the Mexican economy rather than to factories relocating supply chains.
That doesn’t make EWW a bad fund.
It makes it a poor proxy for the thesis people often think they’re buying.
If you want Mexico, EWW gives you Mexico.
If you want factories, it mostly gives you something else.
What the Returns Actually Were
Now the question I started with.
Has Mexico rewarded foreign shareholders despite mediocre economic growth?
These are annualized USD total returns on net asset value, all to June 30, 2026, from the respective fund issuers.
| Fund | 1 year | 3 years | 5 years | 10 years |
|---|---|---|---|---|
| EWW — Mexico | 28.50% | 10.42% | 13.05% | 6.98% |
| IVV — S&P 500 | 22.29% | 20.58% | 13.37% | 15.47% |
| EEM — Emerging Markets | 45.06% | 22.93% | 6.88% | 9.58% |
| EWZ — Brazil | 25.47% | 8.33% | 4.69% | 6.71% |
BlackRock also reports an annualized 9.16% USD NAV total return since EWW’s March 1996 inception.
Calendar years show how rough the ride can be: EWW returned 20.85% in 2021, 1.12% in 2022, 40.43% in 2023, lost 28.26% in 2024 and gained 53.55% in 2025.
Compare that with Vietnam.
The Vietnam ETF I wrote about previously returned just 2.98% a year over the ten years to August 31, 2026, while the underlying economy was growing at rates near 8%.
Mexico gives us almost the reverse puzzle.
Its economy grew slowly, yet EWW produced a respectable foreign-investor return.
I’d be careful about calling that exceptional, though.
Over ten years, EWW’s 6.98% annualized return was less than half IVV’s 15.47% and also trailed emerging markets at 9.58%.
Over five years, Mexico roughly matched the S&P 500 and substantially beat broad emerging markets, but that period begins in mid-2021 and therefore captures a particularly favourable starting point.
A roughly 9% annualized USD return since 1996 is respectable.
It isn’t evidence that Mexican economic integration automatically created extraordinary returns for foreign shareholders.
There’s one test I can’t run honestly.
I’d like to tell you what happened to a broad Mexican stock portfolio bought on January 1, 1994, when NAFTA took effect. I couldn’t retrieve a sufficiently authoritative S&P/BMV IPC or MSCI Mexico total-return history going back that far.
I’m closing that path rather than reconstructing it from questionable historical price points.
EWW since March 1996 is the longest defensible foreign-investor record I have.
And I’m not claiming its historical returns were caused by copper, consumers or anything else. The current portfolio and recent Grupo México results show what investors own today. They are not a 30-year return attribution.
That’s an important distinction.
The Peso Takes Its Cut
The currency story is where the starting date becomes critical.
Using Federal Reserve monthly exchange-rate data, the peso averaged roughly 7.57 per US dollar in March 1996 and 17.38 in June 2026.
That’s a decline of about 56.5% against the US dollar over EWW’s lifetime.
If I mechanically convert EWW’s 9.16% annualized USD return back into a peso-equivalent return using those endpoints, I get roughly 12.2% a year.
The roughly three-percentage-point gap is therefore a useful estimate of the historical currency effect over that particular period.
But I want to be precise about what that number is.
It is not an observed Mexican stock-market total-return index. It is a calculation using EWW’s USD return and the change in USD/MXN.
It’s useful for understanding the magnitude of the currency move, not for reconstructing an official local-market return series.
For a Canadian, the result over that long period is surprisingly similar because the Canadian dollar happened to start and end the period at fairly similar levels against the US dollar.
Change the start date and the story changes dramatically.
From January 2010 to the September 2026 monthly average, the peso lost roughly 26% against the US dollar but only about 0.7% against the Canadian dollar, because the loonie itself weakened substantially against the US dollar.
Use the September 28 spot rate instead of the monthly average and the peso’s loss against the loonie is closer to 4%.
So I wouldn’t write “the peso has been flat against the Canadian dollar since 2010” without immediately giving the dates and methodology.
The larger lesson is simpler.
Currency was a major drag over the roughly 30-year EWW period.
It wasn’t a major drag over every shorter period.
And a Canadian investor’s currency experience can look materially different from an American’s.
The Assets Closest to the Factory Story
If the broad ETF is the wrong shape, what comes closer to the factories?
Three routes stand out.
Industrial property
Mexican industrial landlords are probably the cleanest listed exposure I found.
Their tenants occupy the factories and logistics facilities being built around manufacturing corridors, which makes their operating results much more directly connected to industrial demand than a broad Mexican equity index.
FIBRA Prologis reported period-end occupancy of 95.8% in the second quarter of 2026. Net effective rents on lease rollovers increased 40.8%, while same-store cash NOI increased 13.1%.
Vesta’s SEC-filed second-quarter results showed total occupancy improving from 89.7% in the first quarter to 91.7% in the second. Same-store occupancy was 95%, and the trailing 12-month weighted-average leasing spread was 10.3%.
Those are real operating results.
They still don’t tell me whether the securities are cheap.
I wasn’t able to build a sufficiently reliable current comparison of NAV, price-to-NAV, implied cap rates and leverage across the Mexican industrial-property names.
So the most I can say is:
This is the cleanest economic exposure to nearshoring I found.
I cannot say:
This is an attractively valued investment.
Strong rent growth does not make a stock cheap.
Cross-border rail
Rail is the other obvious physical link.
Grupo México’s GMXT connects its Mexican network with the United States through five border crossings and serves automotive, intermodal, industrial, metals, agriculture and other freight markets.
That makes the transportation division substantially closer to the nearshoring thesis than Grupo México’s mining business.
The Canadian-listed alternative is Canadian Pacific Kansas City, whose network spans Canada, the United States and Mexico.
CPKC reported second-quarter 2026 revenue of CAD 4.2 billion, up 13%, and core adjusted diluted EPS of CAD 1.27, also up 13%.
What I haven’t established is how much of CPKC’s earnings should be attributed specifically to Mexican nearshoring rather than the much larger North American railway.
So I’d call it a North American integration play before I’d call it a Mexico play.
Canadian companies with Mexican plants
Several TSX-listed manufacturers operate in Mexico.
I haven’t done the segment work required to tell you how much of their revenue, profit or invested capital actually depends on Mexico.
So I’m not going to turn “has factories in Mexico” into “is a Mexico stock.”
That research might eventually produce a better Canadian-listed expression of nearshoring.
It hasn’t yet.
Can a Canadian Actually Buy It?
There are several routes, and they express different things.
| Route | What it expresses | Main limitation |
|---|---|---|
| Broad emerging-market ETF | Token Mexico exposure | Mexico is a small country weight |
| EWW or FLMX | Broad Mexican equities | Portfolio doesn’t closely resemble the nearshoring story |
| US-listed Mexican companies | Individual company exposure | Requires company-specific research |
| Direct BMV securities | Full Mexican market, including FIBRAs | Canadian retail-broker access is less straightforward |
| Canadian-listed rail/manufacturers | North American integration | Mexico may be only one part of the business |
Vanguard’s VEE had only about 2.1% in Mexico at the end of August 2026.
So owning a broad emerging-market ETF technically gives you Mexico.
It doesn’t give you a meaningful Mexico thesis.
For dedicated exposure, the obvious practical route for most Canadians is a US-listed fund such as EWW or FLMX through a brokerage account with US-market access.
Direct BMV access is more complicated. Interactive Brokers publishes Mexico-market pricing, but I wasn’t able to establish to my satisfaction that every relevant Mexican security is available to every Interactive Brokers Canada client.
I also didn’t verify the international-trading capabilities of every Canadian bank brokerage, Questrade or Wealthsimple.
So I’m not going to publish a blanket claim that Canadians either can or cannot directly buy Mexican shares.
The important point is that the easy route — a US-listed ETF — is also the route that gives you the least direct version of the nearshoring thesis.
The Tax Layers
This is where the investment vehicle matters.
Mexico’s domestic regime generally imposes withholding on dividends paid to non-residents. The Canada-Mexico tax convention caps Mexican tax on ordinary portfolio dividends at 15% where the treaty applies.
That doesn’t mean every Mexican investment distribution is taxed the same way.
FIBRAs are the important exception.
Mexican tax guidance applying Articles 187 and 188 of the income-tax law generally describes a 30% withholding on the distributed taxable-result component of a FIBRA distribution. A return-of-capital component is treated differently.
What I could not establish confidently enough for publication is whether and how the Canada-Mexico treaty reduces that rate for an individual Canadian FIBRA holder, or how much of a higher Mexican withholding would ultimately be recoverable in Canada.
So I’m not going to manufacture an after-tax comparison between:
- a Mexican corporation;
- a Mexican FIBRA; and
- a US-listed Mexico ETF.
The practical conclusion is narrower.
FIBRAs may be the cleanest economic expression of nearshoring, but their cross-border tax treatment can be materially more complicated for a Canadian than simply buying an ordinary corporation.
Vesta is a corporation rather than a FIBRA, so it sits in a different tax category.
Anyone seriously considering direct Mexican industrial-property securities should confirm the current treatment with a cross-border tax professional before buying.
What about the US-listed ETF?
A US-listed Mexico ETF introduces another layer.
Mexican withholding incurred inside the fund reduces the fund’s return before money reaches the Canadian investor.
Then distributions from the US-listed fund can face US withholding when paid to a Canadian holder.
Under the Canada-US tax convention, ordinary US-source dividends paid to a Canadian resident are generally subject to a 15% treaty rate, while qualifying pension and retirement arrangements receive special treaty treatment.
That’s why a directly held US-listed ETF is generally more tax-efficient from the US-withholding perspective inside an RRSP or RRIF than inside a TFSA.
The conceptual point matters more than the tax-code detail:
An RRSP can address the US-to-Canada withholding layer on a qualifying US-listed investment. It cannot reach through the fund and recover Mexican tax already incurred inside the ETF.
Two layers.
Different rules.
Don’t conflate them.
T1135
CRA’s rules are clearer here.
If the total cost amount of your specified foreign property exceeds CAD 100,000 at any point in the year, you may have to file Form T1135.
CRA specifically says shares of non-resident corporations remain specified foreign property even when they’re held through a Canadian broker.
Units of a non-resident investment fund can also qualify.
Property held inside registered plans such as an RRSP, RRIF or TFSA is excluded from T1135 reporting.
CRA explains those rules in its T1135 questions and answers.
In a taxable account, foreign income taxes may qualify for Canada’s foreign tax credit, generally limited to the lesser of the eligible foreign tax paid and the Canadian tax otherwise payable on that foreign income. CRA’s foreign-tax-credit guidance explains the general calculation.
That’s another reason I’m not publishing a simplistic “30% FIBRA withholding minus 15% credit” calculation.
The real answer depends on the character of the income and the investor’s circumstances.
USMCA and Tariffs
This is the risk I would watch most closely if I were making a nearshoring investment.
USMCA did not expire in 2026
On July 1, 2026, the United States declined to agree to a 16-year renewal of USMCA in its current form.
That sounds more dramatic than what actually happened.
USTR’s own statement says explicitly that the agreement remains in force.
The three countries now continue the review process rather than locking in a fresh 16-year term.
US-Mexico bilateral negotiations have continued on issues including automobiles, steel and aluminum, economic security, labour, agriculture and rules of origin.
That’s uncertainty.
It isn’t the end of free trade.
The tariff system is messy
The tariff picture changed repeatedly during 2025 and 2026, so I wouldn’t quote a single “Mexican tariff rate” and pretend it describes the border.
The US Supreme Court ruled in February 2026 that IEEPA did not give the president authority to impose tariffs under that statute.
Other trade authorities remain.
Automobiles are subject to a Section 232 regime. For USMCA-qualifying vehicles, US rules allow the tariff calculation to account for US content rather than simply applying the headline rate mechanically to the entire vehicle.
Steel, aluminum and copper also remain subject to Section 232 measures. A June 2026 White House proclamation established special treatment for qualifying Canadian and Mexican products based partly on non-US content.
The details vary by product, origin and content.
That’s exactly why I wouldn’t build an investment thesis around one headline tariff number.
The durable point is this:
USMCA qualification and North American content matter more than ever.
That’s good for genuinely integrated North American supply chains and potentially bad for a Mexican plant that relies heavily on inputs from outside the region.
Mexico is pushing in the same direction from its side of the border.
A December 2025 decree changed tariffs on 1,463 product classifications from countries with which Mexico does not have a trade agreement, effective January 1, 2026.
The affected sectors include automotive products, steel, aluminum, textiles, appliances, plastics, furniture and other manufactured goods.
The policy objective is fairly obvious: increase the amount of the supply chain that happens inside Mexico or inside countries with preferential trade relationships.
For nearshoring, that’s potentially both an opportunity and a cost.
Credit and Institutional Risk
Mexico is still investment grade.
But the margin has narrowed.
Moody’s downgraded Mexico to Baa3 with a stable outlook in May 2026, citing fiscal weakening, spending rigidities and continued support for Pemex.
S&P affirmed its BBB foreign-currency sovereign rating in May but changed the outlook to negative, pointing to weak growth, fiscal constraints and contingent liabilities.
So I wouldn’t say Mexico is about to lose investment-grade status.
I would say some of its ratings now sit close enough to the boundary that fiscal deterioration matters.
That’s particularly relevant because the nearshoring thesis depends on more than cheap labour and geography.
Factories require power, transportation infrastructure, legal predictability and long-duration capital.
Mexico has the geography.
The other pieces still require execution.
What Would Have to Be True?
Strip away the country narrative and there are several different investment theses hiding underneath it.
| Thesis | How you’d express it | What has to be true | What breaks it |
|---|---|---|---|
| Nearshoring accelerates | Industrial landlords | Factory/logistics demand stays strong | Trade shock, infrastructure constraints, oversupply |
| Mexican consumption compounds | Consumer names, banks | Formal employment and real incomes rise | Recession, inflation, credit stress |
| North American integration deepens | Rail, Canadian manufacturers | Cross-border volumes keep rising | Protectionism, tougher origin rules |
| Mexican equities re-rate | EWW or FLMX | Earnings outrun valuation compression | Peso weakness, political or credit shock |
| Peso strength continues | Unhedged Mexican assets | Monetary and fiscal credibility holds | Large rate/fiscal shock |
| Copper stays expensive | Grupo México, Peñoles | Metal prices remain high | Commodity downturn |
I’m not ranking those.
They’re different bets.
That’s the important part.
Verdict
My conclusion after going through all of this:
- The nearshoring story is real. Mexico has a massive manufacturing base, and manufacturing alone attracted USD 13.5 billion of FDI in the first half of 2026.
- The headline FDI number overstates how much new capital is arriving. Reinvested earnings represented 88.5% of first-half 2026 FDI, although new investment had surged in 2025 before falling back.
- A large portion of Mexican export value comes from imported inputs. INEGI puts domestic value added at 44.2% of global manufacturing export production in 2024.
- The obvious Mexico ETF doesn’t look much like the nearshoring story. Its biggest position is a copper-heavy mining conglomerate, followed by a bank, convenience stores, telecom, retail, airports and beverages.
- Foreign investors have earned respectable, not exceptional, long-run returns. EWW returned 9.16% a year in USD from March 1996 through June 2026, but only 6.98% over the latest ten years and materially trailed both the S&P 500 and broad emerging markets over that decade.
- Currency mattered enormously over the long run. The peso lost about 56% against the US dollar over EWW’s lifetime. A mechanical currency conversion suggests roughly three percentage points a year between EWW’s USD return and its peso-equivalent return over that specific period.
- The assets closest to the factory story are not the broad ETF. Industrial property and cross-border rail are the cleanest economic exposures I found.
- That doesn’t mean they’re good investments at today’s prices. I don’t have enough valuation evidence to make that leap, and FIBRAs add meaningful cross-border tax complexity for Canadians.
Nothing here lets me say that buying Mexico gets you nearshoring.
Mexico’s nearshoring story can be completely real while the obvious Mexico investment still doesn’t deliver it.
What I’d Actually Do
I wouldn’t buy EWW or FLMX as a nearshoring trade.
If I wanted Mexican equities, I’d treat a broad Mexico ETF for what it actually is: exposure to the Mexican listed market, including commodities, banks, consumers, telecom, airports and the peso.
If the factory thesis were specifically what interested me, I’d start with the assets whose revenues are most directly connected to industrial activity — industrial landlords and cross-border transportation — and then ask the question this article can’t answer for me:
What price am I paying?
I’d also research Canadian-listed companies with meaningful Mexican operations before assuming I need to own a Mexican security at all.
And before buying a Mexican FIBRA, I’d get the Canadian-Mexican tax treatment confirmed. A clean economic thesis can still become a poor investment if too much of the return disappears through valuation, tax or currency.
Finally, I’d size any Mexico position knowing what the historical volatility looks like.
EWW lost 28% in 2024.
Then it gained 54% in 2025.
That isn’t a reason to avoid Mexico.
It’s a reminder that “nearshoring” is a long-duration economic narrative attached to securities whose prices can move very differently from the narrative in any given year.
That’s ultimately what Mexico taught me.
Vietnam showed me that an economy can grow at 8% while the foreign investor compounds at 3%.
Mexico shows the other side of the same problem.
A country can become one of the most important manufacturing platforms in the world without its stock exchange becoming a clean way to own that transformation.
The factories are real.
The investable thesis is much messier.
This article is general information, not financial, tax or legal advice. Tax rules, tariffs, ratings and fund data change. Speak with a qualified cross-border tax professional and a licensed adviser about your own circumstances before investing. Past performance does not predict future results.