
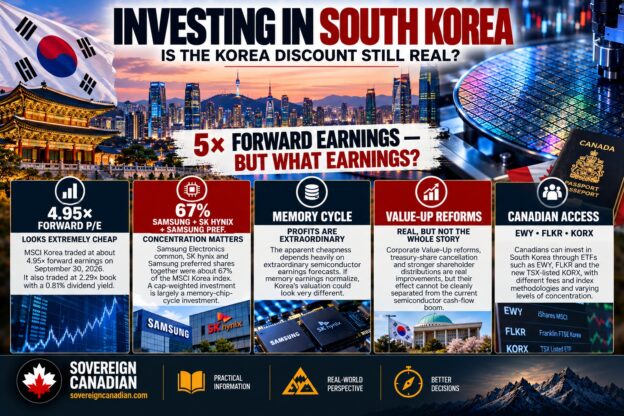
South Korea looks like one of the cheapest major stock markets in the world.
MSCI Korea traded at about 4.95 times forward earnings on September 30, 2026. At the end of August, MSCI Japan was at 16.38 times, MSCI Emerging Markets at 10.07 times, and the broad global MSCI ACWI IMI at 16.76 times. On that number, Korea is priced at roughly half the emerging-market multiple and less than a third of Japan’s.
That looks absurdly cheap.
But the same MSCI data show Korea at 2.29 times book value. Japan was at 2.03 times at the end of August, and emerging markets at 2.40 times. At the end of 2023, according to Robeco’s analysis of Bloomberg data, MSCI Korea traded at about 1.1 times book.
So the Korea discount did not simply vanish, and it did not simply persist. The thing I’m measuring changed.
Samsung Electronics and SK hynix are earning extraordinary memory-chip profits. With Samsung’s preferred shares, they make up about 67% of MSCI Korea. And analyst consensus as of October 2 expected their combined operating profit to climb from roughly ₩91 trillion in 2025 to about ₩953 trillion in 2027.
That forecast is a big part of the denominator behind the roughly 5× multiple.
I started this research assuming I would be writing about governance reform closing a famous valuation gap. That is not what the numbers show. The question I’m left with is a harder one: am I buying a genuinely cheap market, or am I buying peak-cycle earnings dressed up as a bargain multiple?
This article works through that question. It is not a bullish or bearish piece on Korea, and it is not a recommendation. It is an attempt to figure out what a Canadian investor would actually own, and why it might be cheap.
These are unusually fast-moving numbers. Samsung’s third-quarter preliminary results are due after this article was finalized, so every forward multiple and consensus estimate below is dated.
The Korea discount used to be obvious
For years, “the Korea discount” meant something specific and visible: Korean companies traded below their book value and below comparable companies elsewhere, even when their products were world-class.
The numbers were stark. The KOSPI’s average price-to-book ratio was roughly 0.99 over 2014 to 2024, according to the Korea Economic Institute of America, compared with about 1.8 for Japan and 3.7 for the United States. AMRO, the ASEAN+3 regional macroeconomic research office, puts the average return on equity of Korean firms at around 7% over the past decade.
A market that earns 7% on its equity and trades around book is not obviously mispriced simply because the P/B number looks low. The complaint wasn’t only that Korean shares were cheap. It was that the businesses weren’t earning much for shareholders and weren’t paying much out.
The causes commonly cited include low dividend payouts, treasury shares that boards could hold rather than cancel, controlling-family incentives, concerns about minority shareholders and related-party transactions, and weak capital allocation. Cash accumulated rather than being returned.
I want to be careful here. “Chaebols caused the Korea discount” is a neat story, and it may be partly true, but the evidence is not clean. Robeco’s analysis cites research suggesting that since 2007 the discount applied to chaebol-affiliated firms has actually been smaller than for other Korean companies. I couldn’t independently verify that underlying finding well enough to make it a conclusion, so I treat it as a reason for caution. Governance, low returns on equity, capital-allocation habits and shareholder-return policy were all commonly identified contributors. How much each one mattered is harder to say.
What matters for this article is where the discount showed up. It showed up in book value and in weak shareholder returns, not merely in the price-to-earnings ratio.
That is the discount reformers were trying to close, and it is the one that has changed.
That discount has changed
Korea’s figures below are MSCI’s September 30, 2026 numbers. The others are from MSCI’s August 31 data.
| Market (MSCI) | Forward P/E | P/B | Dividend yield |
|---|---|---|---|
| Korea (Sept. 30) | 4.95× | 2.29× | 0.81% |
| Japan (Aug. 31) | 16.38× | 2.03× | 1.72% |
| Taiwan (Aug. 31) | 19.14× | 5.73× | 1.44% |
| Emerging Markets (Aug. 31) | 10.07× | 2.40× | 2.01% |
| ACWI IMI (Aug. 31) | 16.76× | 3.48× | 1.60% |
Korea is extremely cheap on forward earnings. It is not cheap relative to Japan on book value, and it is roughly in line with emerging markets. Its dividend yield is the lowest in the table.
One more clue is in the same MSCI data. Korea’s trailing P/E is 10.25× and its forward P/E is 4.95×. By my calculation, a forward multiple about half the trailing one implies that the earnings underlying the forward number are roughly twice the earnings underlying the trailing number.
So calling Korea “a 5× market” without explaining that this is a forward multiple built on extraordinary consensus semiconductor profits is misleading.
The number is real.
The inference people draw from it often isn’t.
Korea is increasingly a semiconductor investment
The key to reading every number in this article is the composition of the index.
As of September 30, 2026, MSCI Korea was 35.31% Samsung Electronics, 27.58% SK hynix and 4.40% Samsung’s preferred shares.
That is 67.29% in three listed lines.
At the end of August, information technology was about 69% of the index. A different index, the KOSPI, shows a similar concentration problem: Samsung and SK hynix represented roughly half of KOSPI market capitalization around the end of September, according to Korea Exchange data reported by Korean financial media.
I don’t want to overstate this. Samsung is not purely a chip company. It makes phones, displays, appliances and other products.
But its current profit economics are overwhelmingly semiconductor-driven, as the next section shows.
Buying a cap-weighted Korea ETF today is therefore largely buying the Korean memory cycle, with banks, automakers and other industrial companies around the edges.
A small note on company rankings, because the headlines moved fast. On June 22, SK hynix’s common shares briefly overtook Samsung’s common shares in market capitalization, the first time in more than 25 years. The rankings subsequently changed again, and Samsung is larger once its preferred shares are included.
Which company is “bigger” therefore depends on the date and what share classes you’re counting.
It doesn’t matter much to the investment thesis. Together, they dominate the market.
The earnings behind the 5× multiple
Start with what the two companies actually reported for the second quarter of 2026.
Samsung reported revenue of ₩171.5 trillion and operating profit of ₩89.5 trillion.
Its Device Solutions division, which houses the semiconductor businesses, earned ₩89.2 trillion of operating profit on ₩127.5 trillion of revenue. By simple arithmetic, that was about 99.7% of consolidated operating profit.
The mobile and networks businesses lost ₩0.7 trillion.
SK hynix reported revenue of ₩79.3 trillion and operating profit of ₩60.5 trillion, for an operating margin of about 76%.
Its reported net profit of ₩93.9 trillion was actually larger than operating profit because of large non-operating gains, which is why I’m using operating profit throughout this comparison.
Now look at SK hynix’s operating margin over three years, calculated from its results releases and SEC prospectus:
| SK hynix | Operating margin |
|---|---|
| 2023 | −23.6% |
| 2024 | 35.5% |
| 2025 | 48.6% |
| Q2 2026 | 76% |
That is the memory cycle in four numbers.
Now the forecasts.
As of October 2, FnGuide consensus put 2027 operating profit at about ₩552.7 trillion for Samsung and ₩400.1 trillion for SK hynix, a combined ₩952.8 trillion.
A separate FnGuide snapshot from mid-August put combined 2028 operating profit at roughly ₩943 trillion. I don’t have a newer directly comparable 2028 consensus figure, so I would not read the two estimates as though they were captured on the same date.
Their actual combined operating profit in 2025 was about ₩90.8 trillion: Samsung earned ₩43.6 trillion and SK hynix ₩47.2 trillion.
| Combined operating profit, Samsung + SK hynix | ₩ trillions |
|---|---|
| 2024 actual | ~56 |
| 2025 actual | ~91 |
| 2027 FnGuide consensus, Oct. 2 | ~953 |
| 2028 FnGuide consensus, mid-Aug. | ~943 |
Consensus is therefore effectively assuming combined operating profit roughly ten times the 2025 level, with profits remaining extraordinarily high into the following year.
I’m not calling that absurd or wrong.
The forecasts come from analysts looking at real contracts, real pricing and a real shortage. Some estimates have been even more aggressive: Goldman Sachs had combined 2028 operating profit above ₩1,000 trillion in a June forecast.
But the dispersion matters. Some analysts expect DRAM profitability to soften in 2027, and Samsung’s third-quarter expectations were still moving as this article was finalized.
That, I think, is a much better explanation of the 5× multiple than simply saying “Korea is cheap.”
The market is being asked to put a price on the durability of an extraordinary earnings boom.
Stress-testing the 5× multiple
This section is a mechanical stress test, not an earnings forecast.
If MSCI Korea’s earnings came in below the earnings embedded in its current forward valuation, the forward P/E would rise by simple arithmetic.
| Earnings vs current forward assumption | Mechanical P/E |
|---|---|
| Current assumption | 4.95× |
| −20% | ~6.2× |
| −33% | ~7.4× |
| −40% | ~8.3× |
| −50% | ~9.9× |
For reference, MSCI Emerging Markets traded at about 10.07 times forward earnings at the end of August.
By this arithmetic, Korea only reaches roughly that multiple if earnings come in about 50% below the level embedded in today’s forward valuation.
That is a lot of disappointment, and it is a fair point in favour of the “cheap” reading. I’m not suggesting a miss that large is expected.
But the uniform haircut is the gentle version.
The risk isn’t spread evenly across the market.
Combine the October 2 estimates for Samsung and SK hynix — about ₩952.8 trillion of 2027 operating profit — with an October estimate of roughly ₩358 trillion for the rest of the KOSPI 200 excluding those two companies. By my calculation, Samsung and SK hynix represent roughly 73% of the combined operating profit in that comparison.
That is not an official index-earnings statistic. It also uses operating profit rather than net income, which is particularly awkward for banks and insurers.
It is useful as a sensitivity test, not as a reconstructed KOSPI P/E.
Now suppose the two chip companies fell back to roughly their combined 2025 operating-profit level of ₩90.8 trillion while everything else stayed at the 2027 estimate.
Applied mechanically to the current 4.95× starting multiple, the resulting valuation would be roughly 14 to 15 times earnings rather than 5.
Again, that is not a forecast.
It assumes non-chip profits don’t change, mixes an index valuation with operating-profit estimates and deliberately imposes a severe semiconductor normalization.
The point is narrower: the apparent cheapness of Korea is extraordinarily sensitive to the semiconductor earnings denominator.
That matters because cyclical companies can look cheapest on P/E precisely when their earnings are closest to the top of the cycle.
The question isn’t whether 5× is a low number.
It obviously is.
The question is what earnings number deserves to go underneath it.
This is bigger than HBM
It’s tempting to tell this entirely as an AI and high-bandwidth-memory story.
HBM is genuinely important, especially for SK hynix. Its SEC prospectus cites IDC data putting SK hynix’s HBM market share at 56.4% in the first quarter of 2026.
But the 2026 profit surge isn’t only HBM.
SK hynix itself says that both DRAM and NAND prices rose sharply during the second quarter. Conventional memory pricing has become an important part of the earnings boom.
HBM matters partly because it consumes a disproportionate amount of manufacturing capacity. More wafers devoted to HBM can tighten the supply available for ordinary DRAM, which supports pricing elsewhere in the memory market.
That creates a legitimate structural argument.
AI infrastructure spending is large. SK hynix says it has long-term agreements with around ten key customers. New capacity takes time to build. The company’s first Yongin fab is expected to begin coming online in 2027, while advanced packaging capacity is also being expanded.
Samsung likewise said after its second-quarter results that it expected server DRAM, enterprise SSD and HBM demand to keep the market undersupplied through the second half of 2026 despite some moderation in PCs and mobile devices.
And analyst consensus, as we’ve already seen, expects profits to remain extraordinary into 2027 and 2028.
The cyclical argument is just as difficult to ignore.
SK hynix’s operating margin went from −23.6% to 76% in three years.
That is not what a stable utility looks like.
Conventional memory prices have surged. PC and smartphone manufacturers eventually react to component costs. Samsung is investing heavily to improve its position in HBM. SK hynix’s SEC filings identify Chinese producer CXMT as a competitor and also discuss technological and demand risks around memory consumption.
Its largest customer represented 23.9% of 2025 revenue.
New fabs eventually arrive.
And analysts already disagree materially about where earnings go after the current shortage.
I’m not going to resolve that debate because I can’t.
The evidence that would settle it — new capacity arriving versus AI demand absorbing it without destroying pricing — doesn’t exist yet.
That uncertainty is the valuation question.
What happened to investors who bought the old Korea discount?
This is where Korea connects to the rest of the Sovereign Canadian country-investing series.
For years, being cheap and badly treated was supposed to be the opportunity.
Did it pay?
Using MSCI’s published calendar-year net USD returns, a dollar invested in Korea at the beginning of 2016 and held through the end of 2024 produced a cumulative return of roughly 26% by my calculation.
For context, the same exercise produced substantially higher returns in Japan and broad emerging markets, and dramatically higher returns in global equities and Taiwan.
Korea’s problem was not that nobody noticed it was cheap.
It was cheap for years.
Then everything changed.
MSCI Korea returned 99.85% in 2025. The rally continued spectacularly into 2026 before suffering a major reversal.
The lesson is uncomfortable for anyone who likes value investing.
For nearly a decade, the old Korea discount did not translate into superior foreign-investor returns. Then the semiconductor earnings cycle changed the market.
I’m not saying governance reform had nothing to do with the re-rating.
I’m saying the timing and composition of the rally make it difficult to separate the reform story from one of the most extraordinary semiconductor profit booms we’ve seen.
The rally became extraordinarily concentrated
Samsung and SK hynix represented roughly a quarter of the KOSPI around the beginning of 2026 and roughly half by the end of September.
That alone tells you something about what happened.
There is a second way to look at it.
Siblis Research’s KOSPI data showed the index up roughly 114% year over year through August while trailing earnings had risen about 112%. The trailing P/E barely changed, while forward earnings estimates rose even faster and the forward P/E fell sharply.
That is very different from a market simply paying a higher multiple because corporate governance suddenly improved.
It is what an earnings boom looks like.
I would therefore be cautious about attributing Korea’s 2026 rally primarily to Value-Up. The index’s extraordinary gains were heavily concentrated in two semiconductor companies experiencing extraordinary earnings growth.
There is evidence that policy mattered, particularly during earlier stages of the rally. The Korea Capital Market Institute argued when the KOSPI was near 5,000 in January that earnings and policy had both contributed materially.
But the market subsequently became much more concentrated in the chip leaders.
And then it reversed.
The KOSPI closed at a record 9,114.55 on June 22, according to Korea Exchange data reported by Yonhap. It closed at 7,003.74 on October 2.
That’s a decline of about 23% from the record close.
Foreign investors were also heavy sellers during the reversal, with Samsung and SK hynix accounting for much of the selling in September.
A market this concentrated can go up very quickly.
The same concentration works in reverse.
Did Value-Up actually work?
I don’t want to undersell the reforms.
They are more substantive than the “Korea discount” jokes suggest.
The Corporate Value-Up Program itself remains voluntary: companies choose whether to disclose their plans.
But Korea has gone beyond voluntary disclosure.
Dividend taxation
From January 1, 2026 through the end of the 2028 fiscal-year regime, dividends from qualifying high-dividend companies can receive separate taxation rather than being swept into Korea’s comprehensive taxation of financial income.
PwC’s summary says a company qualifies if dividends have not fallen from the FY2024 base and either the payout ratio is at least 40%, or the payout ratio is at least 25% with year-over-year dividend growth of at least 10%.
That’s a real incentive to return more cash.
Treasury shares
The National Assembly passed legislation in February 2026 requiring much more aggressive cancellation of treasury shares.
Under the rules that took effect in March, newly acquired treasury shares generally must be cancelled within one year. Existing treasury shares are subject to a transition period, while disposals and treatment of treasury stock are also more tightly controlled.
That matters because treasury shares historically could be retained and used in ways that weren’t necessarily aligned with minority shareholders.
Then I wanted to follow the cash.
KOSPI-listed companies paid a record ₩35.1 trillion of dividends for fiscal 2025, according to Korea Exchange data reported by Yonhap. That was up 15.5% from the previous year and represented a fourth consecutive annual increase.
Samsung paid ₩9.8 trillion of regular dividends in 2025, plus a ₩1.3 trillion special dividend. It also completed an ₩8.4 trillion share repurchase and cancellation.
The scale increased dramatically in 2026.
Samsung announced an estimated ₩90–110 trillion of shareholder returns for 2026 under its policy of returning 50% of free cash flow over the 2024–2026 period.
SK hynix authorized a ₩40 trillion share repurchase and cancellation in August and increased its shareholder-return target to more than 50% of cumulative free cash flow over 2025–2027.
Those are enormous numbers.
They’re also coming from companies producing enormous amounts of cash.
That distinction matters.
My read is that Value-Up and the surrounding reforms have coincided with measurable improvements in shareholder distributions. Record dividends, mandatory treasury-share cancellation and major repurchase programs are real changes.
But the governance contribution cannot be cleanly separated from the semiconductor cash-flow boom.
Value-Up did not create the memory shortage.
Where the old Korea discount still exists
The article would be too neat if I stopped at “Korea isn’t cheap anymore.”
The traditional discount survives in pockets.
The clearest one is financials.
Several of Korea’s major financial groups still trade around or below book value while producing returns on equity around the high single digits or low double digits. KB Financial, Shinhan, Hana and Woori have also announced meaningful buyback-and-cancellation programs.
That looks much closer to the traditional Value-Up thesis: companies around book value or below it, reasonable returns on equity and improving shareholder distributions.
It doesn’t automatically make them cheap.
Korea’s domestic financial system has its own risks. Household credit has passed ₩2,000 trillion, while the delinquency rate on won-denominated bank loans reached 0.56% at the end of June, its highest June level in a decade.
These are domestic banks exposed to Korean households, property, credit quality, interest rates and government policy.
Cheap banks can stay cheap for very good reasons.
Autos don’t provide an obvious example of the old Korea discount merely because they’re Korean. I couldn’t build a sufficiently consistent current peer comparison between Hyundai and Kia and Toyota, Honda, GM and Ford to make a useful relative-valuation claim, so I’m not going to make one.
More importantly, I looked for a clean valuation of Korea excluding Samsung and SK hynix.
I couldn’t find one that I trust.
I won’t invent it.
The closest useful proxy is MSCI’s Korea Value Weighted Index, which reweights companies using fundamentals rather than simply allowing rising market capitalization to determine the portfolio.
As of September 30, it traded at 5.64× forward earnings, 1.17× book and a 1.82% dividend yield.
That’s a much more traditional value profile than cap-weighted MSCI Korea at 2.29× book and a 0.81% yield.
But it is not an ex-semiconductor index.
Samsung common was still 22.94%, SK hynix 10.38% and Samsung preferred 4.38%.
Together, the three lines were still about 38% of the Value Weighted index.
So the evidence suggests there may be a more traditional Korea-discount opportunity underneath the two giant chip companies.
It does not let me cleanly measure it.
Korea versus Taiwan
Taiwan is the obvious semiconductor comparison, and the valuation gap is enormous.
As of September 30, Korea was at 2.29× book and 4.95× forward earnings.
At the end of August, Taiwan was at 5.73× book and 19.14× forward earnings.
Over the ten years to August 31, MSCI Taiwan had also materially outperformed MSCI Korea.
But these are not the same semiconductor markets.
Taiwan is dominated by TSMC and foundry and logic economics.
Korea is dominated by memory.
I would not reduce the valuation gap to governance.
My interpretation — and it is interpretation rather than proven fact — is that the Korea–Taiwan gap increasingly looks like a memory-versus-foundry earnings-quality gap rather than simply a Korea governance discount.
Investors pay much more for profits they believe will persist.
The market is much less sure about Korean memory profits.
Korea versus Japan
Japan isn’t a template for Korea.
I say that having just worked through the Japanese market in Investing in Japan: Is the Weak Yen an Opportunity?.
Japan’s MSCI index traded at 2.03× book, 16.38× forward earnings and a 1.72% dividend yield at the end of August.
It is also much more diversified.
Korea, as of September 30, was at 2.29× book, 4.95× forward earnings and a 0.81% yield, with 67% of MSCI Korea concentrated in Samsung common, SK hynix and Samsung preferred.
Japan’s reform story has been heavily driven by Tokyo Stock Exchange pressure around capital efficiency, valuations and corporate behaviour.
Korea has combined voluntary Value-Up disclosures with tax incentives and statutory changes.
I haven’t done a sufficiently detailed side-by-side legal study to declare one reform program more effective than the other.
The investment point is simpler.
If a Canadian likes the Japan thesis, adding Korea is not just buying “more Japan.”
The opportunity sets are fundamentally different.
The won
I’ll keep the currency section short.
Federal Reserve historical exchange-rate data show the won at roughly ₩686 per US dollar in January 1990, ₩1,131 in January 2000, ₩1,088 in January 2015, ₩1,529 in June 2026 and roughly ₩1,359 in September 2026.
The won is substantially weaker than it was in 1990 or 2000.
But this isn’t a story of smooth, relentless depreciation.
By my calculation, the long-run depreciation rate from January 2000 works out to less than 1% a year. From 2015 the decline has been closer to 2% a year, and the currency has generally traded in a weaker range since 2022.
Even within 2026, it moved dramatically between June and September.
It is volatile.
I wouldn’t describe it as a currency that simply falls every year.
Remember also that MSCI’s USD returns already incorporate currency movements between the won and the US dollar.
I haven’t built a separate Canadian-dollar Korean equity return series because I couldn’t source a sufficiently consistent long historical KRW/CAD total-return dataset.
That’s a calculation I would rather leave undone than fake.
Can Canadians actually buy Korea?
Yes.
The differences between the available routes matter more than the simple fact that they exist.
EWY
The iShares MSCI South Korea ETF is US-listed and charges a 0.59% expense ratio.
It tracks the MSCI Korea 25/50 Index rather than the uncapped MSCI Korea index I’ve used for much of the valuation discussion.
That distinction matters because the 25/50 methodology constrains concentration.
EWY is still highly exposed to Samsung and SK hynix, but its weights will not match the uncapped MSCI Korea numbers in this article.
FLKR
The Franklin FTSE South Korea ETF charges an expense ratio of 0.09%.
It tracks the FTSE South Korea RIC Capped Index.
That makes it dramatically cheaper than EWY on annual fund expenses and gives it a different concentration profile.
I wouldn’t choose between the two on fee alone. The index methodology matters because the Korean market itself is so concentrated.
KORX
Canadian investors now have a domestic listing as well.
The Global X Korea KOSPI 200 Index ETF, ticker KORX, launched on the Toronto Stock Exchange on September 21, 2026. A US-dollar trading line is available as KORX.U.
The fund charges a 0.45% management fee plus applicable sales tax. Because it is new, a historical MER is not yet available.
KORX seeks exposure to the KOSPI 200 through the Mirae Asset TIGER 200 ETF. It does not employ currency hedging and distributions are scheduled annually.
At inception, Samsung was 33.11% of the portfolio and SK hynix 28.68%.
That’s 61.79% in two companies.
A Canadian listing improves convenience.
It does not solve Korea’s concentration problem.
If you’re comparing ETF wrappers more generally — fees, MERs, spreads and the difference between the investment and the vehicle used to hold it — I went through those mechanics in more detail in Bitcoin ETFs in Canada: Which One Should You Actually Buy?. The underlying asset is obviously different, but the lesson about comparing the wrapper rather than just the ticker carries over.
SK hynix itself
SK hynix now has American depositary shares trading on Nasdaq under SKHY.
According to its SEC prospectus, each ADS represents one-tenth of one SK hynix common share.
The July 2026 offering sold 177.9 million ADSs at US$149 each, implying gross proceeds of about US$26.5 billion before expenses.
That extraordinary number is correct.
Direct Korean shares
Interactive Brokers Canada now provides eligible clients with direct access to Korea Exchange equities.
That includes the ability to buy individual Korean companies rather than accepting the composition of a country ETF.
I haven’t verified every Canadian brokerage, so I’m not going to claim direct KRX trading is universally available.
Samsung does not have a conventional US ADR.
| Route | What it is | Published cost/detail | Concentration |
|---|---|---|---|
| EWY | US-listed MSCI Korea 25/50 ETF | 0.59% expense ratio | Highly concentrated, but capped |
| FLKR | US-listed FTSE South Korea ETF | 0.09% expense ratio | Different capped methodology |
| KORX / KORX.U | TSX-listed KOSPI 200 exposure | 0.45% management fee + tax; unhedged | Samsung + hynix 61.79% at inception |
| SKHY | Nasdaq SK hynix ADS | 1 ADS = 0.1 common share | Single company |
| Direct KRX | Individual Korean securities | Available through IBKR Canada | Investor chooses holdings |
The ETF classification trap Canadians should know
Korea sits in an unusual place in global index construction.
MSCI still classifies Korea as an emerging market. Its June 2026 review continued to monitor improvements in Korean market accessibility but did not reclassify the country.
FTSE treats Korea as developed.
That difference matters to Canadian portfolios.
On the Vanguard side, Korea sits in the developed-market allocation rather than emerging markets.
As of August 31, VEQT had 1.72% of its portfolio in South Korea.
Vanguard’s VEE emerging-markets fund doesn’t provide the Korean exposure because FTSE considers Korea developed.
On the iShares side, the opposite classification applies.
XEC tracks the MSCI Emerging Markets Investable Market Index, so Korea belongs in the emerging-market bucket, while the MSCI developed-market side excludes it.
This creates a practical trap if you build a portfolio by mixing index families.
Pair an MSCI developed-market fund, which excludes Korea, with a FTSE emerging-market fund, which also excludes Korea, and Korea can disappear from the portfolio.
Do the reverse — FTSE developed plus MSCI emerging — and you can own Korea twice.
That used to be an easy detail to ignore.
With Korean equities now representing such a large and volatile semiconductor exposure, it’s worth knowing what your supposedly diversified portfolio actually owns.
Tax for Canadians
I’m keeping this section restrained because I don’t think the evidence supports pretending I can rank these investments after tax for every Canadian account.
Korea’s domestic withholding rate on dividends paid to non-residents is generally 20%, plus local income tax equal to 10% of the withholding amount, producing an effective domestic rate of 22%.
The Canada–Korea tax convention limits Korean tax on ordinary portfolio dividends paid to a Canadian beneficial owner to 15% where the treaty applies.
That does not mean 15% will automatically appear on every distribution from every security.
Korean rules require documentation to claim treaty-reduced withholding, and foreign ETFs introduce another entity between the Korean company and the Canadian investor.
A US-listed Korea ETF can also create a second cross-border layer when the fund itself distributes income to a Canadian holder.
The exact leakage therefore depends on the security, fund domicile, treaty eligibility, documentation and account type.
I don’t have enough evidence to publish a clean after-tax ranking of EWY, FLKR, KORX, direct Korean shares and SKHY across taxable accounts, TFSAs and RRSPs.
So I won’t.
For T1135, the rules are clearer.
CRA says specified foreign property held inside an RRSP, RRIF or TFSA is excluded from Form T1135 reporting. A Canadian mutual fund or Canadian ETF also does not make the investor report the foreign assets held inside the fund simply because the fund owns foreign securities.
Direct foreign shares and units of non-resident investment funds held in a taxable account can be specified foreign property, with the familiar CAD 100,000 aggregate cost threshold potentially triggering T1135 reporting.
The practical conclusion is therefore narrower than a tax optimization table:
Korean dividends can face withholding before they reach a Canadian investor, and the result depends heavily on the investment wrapper.
That is enough reason to check the structure before buying.
It isn’t enough reason for me to pretend one route is universally the most tax-efficient.
What would have to be true?
I find the Korea thesis easier to understand when I separate the different bets hiding inside it.
| Thesis | What has to be true | Evidence supporting it | What breaks it |
|---|---|---|---|
| Korea really is cheap | Semiconductor earnings remain far above historical levels | Extraordinary current profitability; consensus stays elevated into 2027–28 | Chip profits normalize much more sharply than expected |
| The AI-memory supercycle persists | HBM and conventional memory demand absorb new capacity without destroying pricing | Long-term customer agreements, wafer crowd-out, supply constraints | New capacity arrives, customers resist pricing, AI spending slows |
| Value-Up creates a broader opportunity | Higher payouts and better capital allocation spread beyond the chip windfall | Record dividends, cancellation law, major buybacks | Payout gains prove cyclical or reform momentum stalls |
| The old discount survives outside chips | Below-book businesses improve ROE and shareholder returns | Banks and Value Weighted index still look much cheaper on book | Credit problems or poor capital allocation persist |
| Korea is a value trap | Semiconductor profits normalize while non-chip returns remain mediocre | Long pre-2025 period of weak relative returns | High semiconductor profitability proves structurally durable |
Those aren’t the same thesis.
That’s the main thing I would want to know before putting more money into Korea.
What would I actually do?
This is my own framework, not individualized investment advice.
I would not buy Korea simply because the index says 5× forward earnings.
That number depends too heavily on extraordinary semiconductor earnings estimates.
I’ve shown how quickly the apparent valuation changes when you change the denominator.
I also wouldn’t dismiss Korea.
Samsung and SK hynix are genuinely world-class companies sitting near the centre of AI infrastructure spending. The memory shortage is real. HBM demand is real. Korea’s shareholder-return reforms are also more substantive than they were a few years ago.
But the trade is different from what the phrase “Korea discount” suggests.
If I wanted broad Korea exposure, I would compare FLKR, EWY and KORX on cost, index methodology, concentration, currency structure and Canadian convenience.
If I specifically believed the AI-memory thesis, I would recognize that buying a cap-weighted Korean index is already largely making that bet.
And if I already owned a broad Canadian asset-allocation ETF such as VEQT or XEQT, I would first check how much Korea I already own and through which index family.
If I wanted the traditional Korea-discount thesis — below-book businesses plus improving shareholder returns — the financial sector looks like a more intellectually consistent place to start researching than an index dominated by two semiconductor companies.
That doesn’t mean Korean banks are a buy.
It means they better resemble the thesis I’m supposedly trying to express.
This fits a pattern I’ve found across the country-investing series.
Japan showed that a slow-growing, mature economy can still contain interesting investments.
Vietnam showed that rapid GDP growth doesn’t necessarily reach foreign shareholders.
Mexico showed that a real nearshoring boom doesn’t automatically make the domestic stock index the best way to own it.
Korea adds another lesson.
An apparently cheap market can stop being a broad value opportunity and become a concentrated cyclical earnings bet without the headline valuation making that obvious.
Korea may still be cheap.
But the reason has changed.
Ten years ago, the question was whether poor governance, weak capital allocation and low shareholder returns justified a permanent Korea discount.
Today, the bigger question is whether Samsung and SK hynix can earn anything close to what analysts expect them to earn.
At five times forward earnings, those can sound like the same question.
They aren’t.
This article is for general information and is not personal investment, tax or legal advice. Valuations, portfolio weights and analyst estimates are dated as stated and can change quickly.