
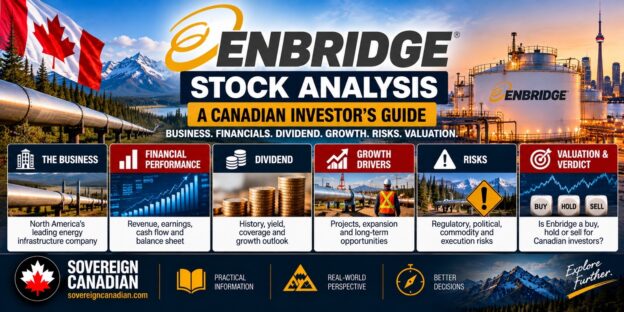
Enbridge is one of the first names a Canadian dividend investor learns, and that familiarity is part of the problem. A long dividend record and a yield near 6% tell you the company is a reliable payer. They do not tell you whether the stock is cheap, or whether owning it will build wealth faster than the alternatives. Those are three different questions, and Enbridge answers them differently.
This analysis uses a research reference date of October 13, 2026, and a reference price of CAD 67.15 per share on the TSX (an intraday quote). All yields and multiples below are calculated from that price. If the stock has moved by the time you read this, the ratios move with it, and the conclusions about price matter more than the exact figures.
| Objective | Rating | The short reason |
|---|---|---|
| Value | Hold | Fair value is about CAD 70, only around 5% above the price |
| Dividend income | Buy | 5.78% yield, covered by guided cash flow, long record of increases |
| Long-term total return | Modest Buy | About 8.9% a year modelled over ten years, respectable but not exceptional |
My view is that Enbridge stock is primarily an income investment. It is a sound one. It is not obviously cheap, and the growth it delivers to each shareholder is slower than the size of the company suggests. The rest of this article explains why, and at what price the picture changes.
What does Enbridge actually own?
Enbridge is a toll road for energy. It moves crude oil and liquids, transports and stores natural gas, delivers gas to homes and businesses, and holds a smaller portfolio of renewable power assets. In 2025, liquids pipelines produced about 49% of adjusted EBITDA, natural gas transmission about 27%, regulated gas utilities about 21%, and renewables and other about 4%. Add the two gas businesses together and natural gas is roughly half the company, which surprises many people who still think of Enbridge as an oil pipeline.
The business model matters more than the molecules. The Mainline, the system that carries Western Canadian crude to refineries and export points, earns tolls under a settlement with shippers that runs through the end of 2028. Gas transmission mostly collects reservation fees, which are paid whether or not the gas flows. The gas utilities, including Enbridge Gas in Ontario and utilities in Ohio, Utah and North Carolina, earn an allowed return on the assets regulators let them put in the rate base. In all three cases, revenue depends on contracts, tolls and regulatory decisions more than on the day-to-day price of oil or gas.
That is not the same as zero exposure. Volumes matter, because shippers will not commit to pipelines for crude that is not being produced. A few pieces of the business, including an equity stake in a gas midstream company, are linked to commodity prices. And regulators and courts can change the terms. A fair description is an energy infrastructure company with a modest and indirect link to commodity cycles, not a bet on the oil price.
The economic advantage is real. A pipeline corridor that took decades to permit and build is very hard to replicate, and a regulated utility with a growing rate base compounds earnings in a predictable way. The company reports having met its annual guidance for twenty straight years. The question for an investor is how much of that quality is already in the price, and how much of the cash it generates actually reaches shareholders on a per-share basis.
Enbridge’s dividend: attractive, but how safe?
Enbridge pays CAD 0.97 per share each quarter, or CAD 3.88 annualized. At CAD 67.15 that is a yield of 5.78%. The company reports 31 consecutive annual dividend increases, and the most recent increase was about 3%. The yield sits roughly two percentage points above the Government of Canada ten-year bond, which was near 3.75% in August.
Enbridge does not judge its dividend against earnings per share, where the payout is well above 100%. It uses distributable cash flow, or DCF, a non-GAAP measure that starts with operating cash flow before working-capital changes and subtracts maintenance capital spending, distributions to minority partners and preferred dividends. For 2026 the company guides to DCF of CAD 5.70 to 6.10 per share. At the midpoint of CAD 5.90, the CAD 3.88 dividend is a payout of about 66%, inside the company’s target range of 60% to 70%.
That figure is real but needs careful reading. DCF deducts the money required to maintain existing assets. It does not deduct growth capital, which is the money spent on new projects, and Enbridge spends a lot of it. In 2025, DCF was CAD 12.5 billion and common dividends were CAD 8.2 billion, leaving about CAD 4.2 billion. Total capital spending was CAD 9.0 billion, of which roughly CAD 7.8 billion was growth. Over the trailing twelve months to June 2026, operating cash flow of CAD 12.4 billion did not cover capital spending of CAD 10.8 billion plus dividends, and the gap of around CAD 7.8 billion was filled with CAD 8.6 billion of net new debt. So the 34% of DCF that the dividend leaves over is not spare cash. It is partial funding for a growth program that is also paid for with borrowing.
That does not make the dividend precarious. It makes it a different kind of safe than a company that funds everything from cash flow. Growth capital is a choice. If financing tightened, management could slow new projects long before touching the dividend, because maintenance spending is only about CAD 1.2 billion a year. I built a five-year stress model of the financing, and it held up better than I expected. With interest costs 100 basis points higher, the payout stayed near 65%. In a combined downside, with slower growth, weak capital markets, lower project returns and higher rates together, the payout reached about 85% of DCF and the dividend was still covered. In that scenario, though, DCF per share fell by roughly 3% a year, which means the dividend would be safe but could not grow. This is a simplified model of my own, not company data, but it points to the real vulnerability. The dividend is not what breaks first. Per-share growth is.
My assessment: the dividend is well supported for the foreseeable future, and a freeze would come long before a cut. The thing to watch is whether it keeps growing faster than inflation, which depends on the next two sections.
The balance sheet: Enbridge’s biggest financial constraint
Enbridge carries a lot of debt. Total debt was CAD 112 billion at June 30, 2026, including about CAD 16 billion of long-dated subordinated notes that receive partial equity credit from rating agencies. Interest expense was CAD 5.0 billion in 2025, about a quarter of EBITDA.
Leverage needs a careful definition, because there are two numbers in circulation. The company’s own measure is a rolling twelve-month Debt-to-EBITDA ratio. It was 4.8x at the end of 2025 and 5.1x at June 30, 2026, above the company’s 4.5x to 5.0x target. The company said part of the increase was a currency effect, since period-end debt was translated at 1.42 Canadian dollars per U.S. dollar while the earnings were translated at an average near 1.38. A simple calculation of net debt divided by trailing EBITDA gives 5.5x. These are different measures, because the company’s version treats cash, hybrid securities and adjustments in ways I could not fully reconstruct from public documents. I use the company figure when comparing against its target and keep the simple ratio separate.
The credit ratings are solidly investment grade, in the BBB+ and Baa2 range at the major agencies. The issue is not solvency. It is flexibility. A company running above its target leverage, with CAD 41 billion of secured projects to build, has less room to absorb rate shocks, cost overruns or a weak equity market.
That is the context for the September 2026 equity offering. Enbridge sold 44.735 million new common shares at CAD 66.85, including the over-allotment option, for gross proceeds of about CAD 3.0 billion and net proceeds of about CAD 2.9 billion, closing on September 14. The company said the money would partly fund announced acquisitions, namely the Tallgrass crude assets (US 2.55 billion) and Salt Creek gathering (US 600 million), and provide financial flexibility. The prospectus also allows proceeds to be held in short-term investments or used to reduce borrowings temporarily. As of October 13, I found no announcement that either acquisition had closed, and I do not know how the cash has been used since September. It would be a mistake to assume the offering permanently paid down debt.
The trade-off is straightforward. Equity strengthens the balance sheet and supports the acquisitions, but the 44.7 million new shares are about 2% more shares among which every future dollar of cash flow must be divided. On my estimates, the acquisitions are roughly neutral to slightly accretive to DCF per share in the first year, and the company’s own view is that they will be accretive. Counting the offering, the acquisitions and the debt that funds the rest, leverage on the company’s measure would stay near 5.1x. That is not a deleveraging story.
Enbridge’s growth problem: EBITDA versus growth per share
This is the section where the quality of the business and the quality of the investment come apart. From 2022 to 2025, Enbridge grew adjusted EBITDA by about 9% a year, from CAD 15.5 billion to CAD 20.0 billion. Total DCF grew by about 4% a year. DCF per share grew by only 1.7% a year, from CAD 5.42 to CAD 5.71. The dividend per share grew by about 3% a year, from CAD 3.44 to CAD 3.77.
The gap exists because shareholder returns are measured per share, and the company grew in part by buying assets with borrowed money and new equity. The weighted share count rose about 8% over those three years, and interest costs rose faster than cash flow in 2025, up 11% against DCF growth of 4%. Higher depreciation from new assets and the fixed percentage returns allowed on regulated utility assets also mean that a larger company does not translate one-for-one into larger earnings per share. Enbridge is not failing to grow. It has built a bigger and better-diversified business. But corporate growth and shareholder compounding are not interchangeable, and so far the second has lagged the first.
Management’s outlook is for roughly 5% annual growth in EBITDA, DCF per share and earnings per share in the years after 2026. That is guidance, not a record. My financing model can reproduce about 4.4% a year for DCF per share, but only if new projects earn something near 11% on the capital invested (before interest) and the company needs no new equity. If projects earn closer to 8%, DCF per share growth drops to roughly 3%, and with weaker returns plus higher funding costs it can turn negative. The Tallgrass price, at 10 to 11 times forward EBITDA, falls in the middle of that range. It works comfortably if financed with debt, and is close to break-even if financed with equity, which is what the September offering did. Whether the 5% target is credible depends on project returns, funding costs and discipline on issuance, and the recent record only partly supports it.
Is Enbridge stock undervalued?
I estimate fair value three ways. The first applies a multiple to 2027 expected DCF per share, using 11.5 times, which is close to the company’s recent range. The second is a dividend discount model, which values the stock as the present value of a growing dividend stream, using an 8% required return and 3% dividend growth fading to 2%. The third is an enterprise value to EBITDA cross-check at about 12.8 times. Each has a weakness. The multiple method assumes the market keeps valuing cash flow the way it does now. The dividend model is highly sensitive to the discount rate and growth rate. The EBITDA method ignores differences in leverage and in how much of EBITDA turns into cash for shareholders.
| Method | Bear | Base | Bull |
|---|---|---|---|
| DCF per share multiple | 57 | 70 | 84 |
| Dividend discount model | 51 | 71 | 97 |
| EV/EBITDA cross-check | 53 | 70 | 84 |
| Average | 53 | 70 | 88 |
All values are in CAD per share and rounded. The central estimate is about CAD 70, and a reasonable range is roughly CAD 62 to CAD 78, based on varying the discount rate between 8.0% and 8.5% and dividend growth between 2% and 4%. The September offering and the pending acquisitions barely change this. I tested five ways of treating them and fair value stayed between about CAD 70 and CAD 71.
At CAD 67.15 the shares trade about 5% below that central value, which is well inside the uncertainty of the estimate. The stock trades at 11.4 times 2026 guided DCF per share and about 13.0 times EBITDA. Looking back over the last five year-ends, price to DCF averaged about 10.2 times, and Enbridge finished 2025 at 11.5 times, so today’s multiple is about 12% above the five-year average and level with the end of last year. The yield of 5.78% compares with a five-year average near 6.7%. Reliable year-end prices before 2021 were not available to me, so I will not claim anything about a ten-year range.
Fair value is not the same as a good purchase price. A stock priced at its fair value gives you its modelled return and no cushion for being wrong. Value investors want a gap between price and value, and at CAD 67.15 that gap is small. That is why the value rating is Hold.
What could Enbridge return over the next ten years?
The expected return from a stock like Enbridge has four parts: the starting dividend yield, growth in the dividend, any change in the valuation the market puts on that dividend, and the effect of reinvesting. My model uses a base case in which the dividend grows 3% a year and the stock still yields 5.8% in ten years, so there is no re-rating either way. The bear case has 1% growth and a yield that widens to 7.0%. The bull case has 5% growth and a yield that narrows to 5.0%.
| Scenario | Dividend growth | Yield in year 10 | Annualized return |
|---|---|---|---|
| Bear | 1% a year | 7.0% | 5.39% |
| Base | 3% a year | 5.8% | 8.92% |
| Bull | 5% a year | 5.0% | 12.25% |
These are modelled outcomes before personal taxes, not forecasts. The base case is almost entirely the 5.78% starting yield plus 3% dividend growth. The year-ten yield is measured on the same basis as today’s 5.78%, so the base case builds in no hidden re-rating. A diversified Canadian equity fund might plausibly deliver around 8% (my own assumption), so the base-case edge for Enbridge is under one percentage point, bought with single-company and leverage risk.
To make this concrete, CAD 10,000 invested at CAD 67.15 and left to reinvest every dividend would grow to roughly CAD 17,000 in the bear case, CAD 23,500 in the base case and CAD 31,700 in the bull case after ten years. These are hypothetical results from the model’s price paths, in a tax-free account, and are not projected account balances. Enbridge’s own dividend reinvestment plan is suspended, so reinvestment here means a broker’s reinvestment program or manual purchases. If you take the dividends as cash, the combined value of shares plus cash received is about 14% lower in the base case, because the cash stops compounding in the stock.
At what price would I buy Enbridge?
The model also shows how much the entry price matters. Because the terminal assumptions do not depend on what you paid, each CAD of price you save or overpay changes the return mechanically.
| Entry price (CAD) | Starting yield | Base-case 10-year return |
|---|---|---|
| 52 | 7.5% | 12.60% |
| 55 | 7.1% | 11.77% |
| 60 | 6.5% | 10.51% |
| 62 | 6.3% | 10.04% |
| 67.15 | 5.78% | 8.92% |
| 70 | 5.5% | 8.35% |
| 75 | 5.2% | 7.41% |
A base return of 10% needs a price around CAD 62. At about CAD 60 or below, the starting yield is 6.5% and even the bear case still earns close to 7%, so I would call that attractive. At CAD 52 or below the base return is above 12% and the bear case is about 9%, which is where Enbridge becomes a strong value as well as an income holding. I would start to lose interest above roughly CAD 72, where the modelled base return falls to 8%, no better than the diversified alternative I used as a benchmark.
These are valuation thresholds derived from assumptions, not trading signals. Enbridge could trade at CAD 62 because the outlook has deteriorated, and the base case would then be too optimistic. A lower price is only a better deal if the business behind the price has not changed.
The risks that matter most
The risk that matters most is not a dividend cut. It is that per-share growth fails to materialize. Leverage above target, interest costs that absorb EBITDA growth, and further share issuance can combine to turn management’s 5% outlook into something closer to 2%. In that outcome the dividend would be safe but would barely grow above inflation, and the stock would look like a bond with equity risk.
Refinancing and interest rates feed directly into that risk. Every 100 basis points on CAD 10 billion of refinanced debt costs about CAD 100 million a year, or around 0.8% of 2026 DCF per share. The Canadian policy rate was 2.25% and the ten-year yield near 3.75% in the data I used, but the company carries a large stack of debt and a leveraged balance sheet is where higher-for-longer rates hurt.
The Mainline is the largest franchise risk. The Mainline and market access businesses generated about two thirds of the liquids segment’s EBITDA in the second quarter, and the tolling settlement expires at the end of 2028. I found no successor arrangement. Second-phase expansion of the Mainline is being resequenced because producer commitments are insufficient.
Line 5 is the most visible legal risk, and none of it is settled. In Wisconsin, the Seventh Circuit ruled on July 30, 2026 that Line 5 trespasses on the Bad River Band’s land, sent the damages back to the district court, and removed the earlier three-year deadline to shut or reroute the line, giving Enbridge a reasonable opportunity to finish a roughly US 1 billion reroute that is under construction. In Michigan, the state Supreme Court on July 31 vacated regulatory approval of the Straits tunnel and sent the application back to regulators, the U.S. Supreme Court ruled in April that the Attorney General’s lawsuit stays in state court, and the state’s appeal over the easement is pending in the Sixth Circuit. I do not know how any of these will end.
Other risks are more ordinary but real: project cost overruns, integration of the Tallgrass and Salt Creek assets, rate-case outcomes in Ohio, Utah and North Carolina, and long-term uncertainty about oil and gas demand. There is also a management transition. On September 8, Enbridge announced that CEO Greg Ebel will retire on December 31, 2026, and Michele Harradence, who runs the gas distribution business, will take over on January 1, 2027. No change in strategy or guidance was announced, but a new CEO arrives while the company is digesting acquisitions with above-target leverage.
Enbridge versus other Canadian dividend investments
Enbridge sits at the high-yield, moderate-growth end of the Canadian infrastructure and utility group. Fortis has a more predominantly regulated utility profile and emphasizes dividend growth, while Hydro One has a mostly Ontario-regulated business and a different balance-sheet and growth profile. Exact comparative yields and leverage ratios should be checked at the time of publication. Capital Power and Brookfield Renewable offer different mixes of contracted power, growth and risk, and I have not verified current comparisons for them. I did not capture current leverage or growth data for peers, so I will not rank them on valuation.
What the comparison shows is that the highest yield is not necessarily the best investment. Enbridge pays the most income now, and a buyer of Fortis or Hydro One accepts less income in exchange for steadier per-share growth and a stronger balance sheet. Our fuller comparison, Best Canadian Utility Stocks, looks at those trade-offs across the group. For an investor who wants income now, Enbridge is a reasonable answer. For the cleanest long-term compounding, a diversified fund is hard to beat, which I discuss in ETFs vs. mutual funds vs. individual stocks. Enbridge is also a Canadian energy-infrastructure company and a large weight in the TSX, so it is worth knowing how much of it you already own through index funds, which is the subject of our guide to stock market indices including the TSX.
Where should Canadians hold Enbridge stock?
Enbridge designates its common-share dividends as eligible dividends, which means the dividend tax credit applies in a non-registered account. The company’s dividend tax page lists the exceptions, which are two past dividends from 2012 and 2013. Eligible dividends are taxed more lightly than interest, but they are not tax-free, and you owe the tax every year whether or not you spend the cash. Our guide to dividend tax treatment in Canada explains the gross-up and credit mechanics.
The tax cost rises quickly with income. As an illustration using 2026 federal and Ontario rates, and ignoring other credits, CAD 10,000 of Enbridge dividends added on top of other taxable income would cost roughly CAD 640 in tax at CAD 75,000 of other income, about CAD 1,765 at CAD 125,000, about CAD 2,220 at CAD 175,000 and about CAD 2,850 at CAD 250,000. These are illustrations, not a personal tax calculation, and some of the 2026 inputs should be confirmed against the Canada Revenue Agency’s tables.
| Account | What happens to Enbridge dividends and gains | Best fit |
|---|---|---|
| TFSA | Tax-free, no effect on income-tested benefits | Retirees near the OAS threshold; investors with room to spare |
| RRSP / RRIF | Tax-deferred; fully taxable on withdrawal at ordinary rates | Investors whose deduction rate today exceeds their rate in retirement |
| Non-registered | Dividends taxed yearly at the eligible rate; gains deferred | Investors with available taxable capital who value eligible-dividend treatment |
On the TFSA, Enbridge’s dividends and growth are sheltered completely, and the dividends do not enter net income. That matters for retirees. OAS recovery tax claws back 15% of net income above a threshold, which is CAD 95,323 for income earned in 2026, according to Service Canada. Because eligible dividends are grossed up by 38% before they count as income, CAD 10,000 of Enbridge dividends received by a retiree with CAD 90,000 of other income would cost roughly CAD 1,900 in combined tax and recovery tax, or about 19%, versus about 6% on a dividend below the threshold. The recovery tax for 2026 income is deducted from OAS payments between July 2027 and June 2028, so the bill arrives well after the dividend. Dividends in a TFSA avoid this entirely. Our TFSA deep dive covers the rules, and the opportunity cost is real: TFSA room used on Enbridge is room not used on something with a higher expected return.
An RRSP or RRIF defers tax, but withdrawals are fully taxed as ordinary income, so the dividend tax credit is lost. The fair comparison is not CAD 10,000 in each account. A CAD 10,000 RRSP contribution costs a person at a 43% marginal rate about CAD 5,660 after the deduction, so the equivalent TFSA contribution is CAD 5,660. On those terms, with Enbridge’s base-case growth, both reach about CAD 13,300 after ten years if the RRSP is withdrawn at the same tax rate, while a non-registered account at the CAD 125,000 income level reaches about CAD 11,500. The RRSP does better if you will be in a lower bracket in retirement, and worse if you will not. Our RRSP versus TFSA guide and RRSP retirement guide go further. RRIF withdrawals count as income for OAS recovery.
No account is universally best, because the right location depends on everything else you own. Qualifying U.S.-source dividends paid directly to an RRSP can benefit from a Canada-U.S. treaty withholding exemption, although the result depends on the security and holding structure, and Enbridge does not need that advantage because its dividends are Canadian-source. Low-yield growth investments such as a stock paying no dividend, like Berkshire Hathaway, can be comparatively tax-efficient in a non-registered account because gains may be deferred and only the taxable portion is included in income. Enbridge’s high Canadian dividend makes sheltering valuable, and in my illustration, sheltering CAD 10,000 of Enbridge for ten years was worth roughly CAD 3,100, about 1.5 percentage points a year, more than for most holdings. The sensible approach is to decide what to own first and then place each holding where it saves the most tax.
One more thing for non-registered investors: if you sell Enbridge at a loss and buy it back, the superficial-loss rule can deny the loss. The window runs 30 days before to 30 days after the sale, it applies to purchases by your spouse and to purchases inside your TFSA or RRSP, and a loss denied because of a repurchase in a registered account is effectively lost. A broker’s automatic dividend reinvestment during the window can also trigger a partial denial. Check with an accountant before harvesting a loss.
On the TSX versus NYSE question, Enbridge is a Canadian corporation whichever exchange the shares trade on, and the listing does not turn a Canadian-source dividend into a U.S.-source one. For most Canadians holding Canadian-dollar accounts, buying the TSX line is simpler and avoids currency conversion. The 25% non-resident withholding rate, reduced to 15% for qualifying U.S. residents under the treaty, applies to non-residents of Canada, not to Canadian residents. How a particular U.S. broker treats a Canadian resident’s NYSE position in practice is something I could not verify, so check your first dividend statement for any withholding line. A T1135 foreign property form is required only when the cost of specified foreign property exceeds CAD 100,000, and where the shares are held matters. Our overview of TSX, NYSE and Nasdaq listings gives background. The Canada Revenue Agency’s RRSP page is the starting point for registered-plan rules.
Who should own Enbridge?
A high-income accumulator in their 30s to 50s, with a long horizon and no need for portfolio income, should treat Enbridge as optional. Its base-case return is under one point better than a diversified fund, with more concentration, and its dividend is a tax drag in a non-registered account at a high bracket. If that investor holds Enbridge, a TFSA or RRSP is the place, and only after the higher-growth holdings have claimed room. Someone who already owns large positions such as Fairfax and Berkshire may find Enbridge diversifying, since its cash flows are different, but a broad index fund is a cleaner diversifier.
An investor approaching retirement with a large RRSP has a better case. Enbridge’s yield can fund RRIF minimums with fewer share sales, its cash flows are relatively predictable and its dividend has a long record. The limits are concentration, which argues for a modest weight in the income sleeve and not the whole of it, and the fact that RRIF withdrawals are fully taxable.
A retiree drawing portfolio income is where the income case is strongest, and the TFSA is the best home because it keeps dividends out of net income and away from OAS recovery tax. The limits are the same: one company, high leverage, and a dividend that grows only a little faster than inflation. Age alone does not decide any of this. What matters is how much of the portfolio the position represents and which account holds it.
Final verdict: is Enbridge a buy?
It depends on what you are buying it for, and the three ratings reflect that.
- Value: Hold. At CAD 67.15, the stock trades about 5% below my central fair value of CAD 70, with multiples above their five-year average and leverage above the company’s target. There is no meaningful margin of safety. The rating moves to Modest Buy around CAD 62 and to Buy at about CAD 60 or lower.
- Dividend income: Buy. A 5.78% yield covered about 1.5 times by guided cash flow, with a long record of increases, financing that holds up under stress and the possibility that management could freeze dividend growth before considering a reduction. This is the strongest case for owning Enbridge.
- Long-term total return: Modest Buy. A modelled 8.9% a year is respectable, and it comes from the yield and 3% growth, not from a bargain price. Per-share cash flow has grown 1.7% a year since 2022, and the 5% outlook is not yet a record.
A dividend stock is still an investment in a business, and the price you pay is part of the return. Enbridge is a sound business that pays well. At the October 13 reference price it is a way to be paid to wait, preferably inside a TFSA or RRSP, and not a reason to expect more than a high single-digit return. Below CAD 62 the conclusion improves, and at CAD 60 or below I would be a buyer for value as well as income. At CAD 72 and above I would look elsewhere.
This article is general information, not personalized investment, tax or legal advice. Figures reflect a research reference date of October 13, 2026 and modelled assumptions, which may prove wrong. Check current prices and tax rules, and consider speaking with a qualified professional before acting.
Sources: Enbridge’s second-quarter 2026 results, its bought-deal announcement and closing announcement, its CEO succession announcement, the Mainline Tolling Settlement page, the U.S. Supreme Court’s opinion in Enbridge Energy v. Nessel, the Seventh Circuit opinion, and the Michigan Supreme Court decision.