
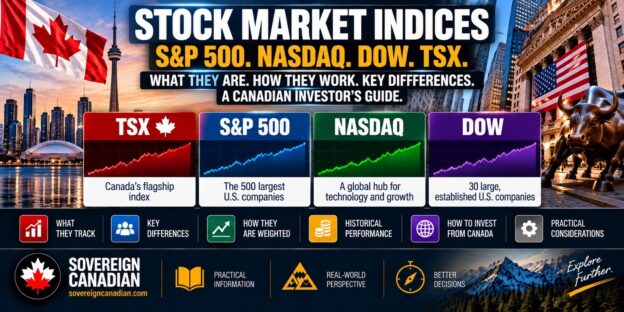
Financial headlines tell you the Dow gained 300 points, the Nasdaq fell 2%, the S&P 500 hit another record and the TSX outperformed Wall Street. Each sentence describes a different group of companies, counted by different rules. A 300-point move in the Dow isn’t comparable with a 300-point move in the S&P 500. A rising Nasdaq-100 doesn’t mean the average American stock is doing well. A strong TSX doesn’t mean Canada’s economy is beating the United States.
Stock market indices are how we summarize markets, and index funds are how most of us own them. When you buy an index ETF, you’re buying a methodology: which companies, in what proportions, measured in which currency. This is the second article in the Understanding Stock Markets series. It covers what the major benchmarks measure, why they diverge and what that means for a Canadian portfolio.
What Stock Market Indices Actually Measure
An index is a rule-based list of securities plus a formula that turns their prices into one number. The rules decide which companies get in. The formula decides how much each one counts. The provider recalculates the number from live prices, and the change in that number is the headline. It’s a yardstick, which makes it useful and also means you can’t buy it.
Three things get confused here. A stock exchange is a marketplace where securities are listed and traded, which Article 1 on TSX, NYSE and Nasdaq covers. An index measures a chosen group of securities, which may trade on one exchange or several. An index-tracking ETF or mutual fund is the product that holds the securities and gives you the exposure. The S&P 500 isn’t an exchange, and the Nasdaq-100 isn’t the Nasdaq.
The Major US Stock Market Indices
The S&P 500 holds 500 large US companies covering roughly 80% of the US market’s capitalization, according to S&P Dow Jones Indices. It isn’t simply the 500 biggest. Under the S&P methodology, a company must be US-domiciled, meet minimum market capitalization, liquidity and float requirements, and satisfy earnings criteria. An index committee then has the final say, so selection involves judgment. Weights follow float-adjusted market capitalization, meaning each company counts in proportion to the value of its shares available to public investors. The 500 counts companies; the index can hold more than 500 share lines because each listed class of a dual-class company can be included.
The Dow Jones Industrial Average is the odd one out. It holds 30 companies picked by a committee that includes Wall Street Journal representatives, and its methodology says selection isn’t governed by quantitative rules. It is price-weighted: the 30 share prices are added and divided by a divisor that S&P adjusts when corporate actions would otherwise distort the level. A 1% move in a USD 400 share shifts the price sum by USD 4, while a 1% move in a USD 40 share shifts it by USD 0.40. A company’s share price reflects how many shares it issued and split, not how large it is. Add the omission of transportation and utilities, and the Dow is a famous blue-chip gauge, not a broad benchmark.
The Nasdaq Composite and the Nasdaq-100 are not interchangeable. The Composite includes essentially every common-type security listed on the Nasdaq Stock Market, including ordinary shares and ADRs of foreign companies, but excludes ETFs, preferred shares, warrants and similar instruments. It has no size, sector or liquidity screen, weights by market capitalization using total shares outstanding and updates daily, so its count has no fixed number. The Nasdaq-100 is about 100 of the largest Nasdaq-listed companies, excluding financials, with a liquidity requirement and a modified market-cap weighting whose caps limit the biggest weights. It’s reconstituted each December and rebalanced quarterly. Both lean toward technology, but the Nasdaq-100 is far more concentrated, and neither measures the Nasdaq exchange as a whole.
The Russell 2000 is the standard US small-cap benchmark. In FTSE Russell’s structure, the Russell 3000 is the broad market index, the Russell 1000 is its large-cap subset and the Russell 2000 the small-cap subset, all weighted by float-adjusted market capitalization. Smaller companies often depend more on outside financing, so interest rates, credit conditions and the economic cycle can matter more to them than to the mega-caps that dominate the S&P 500.
| Index | Approximate constituents | Segment | Weighting | Main limitation |
|---|---|---|---|---|
| S&P 500 | 500 companies | US large-cap | Float-adjusted market cap | Largest names dominate; not every US company |
| Dow Jones Industrial Average | 30 | Selected US blue chips | Price | Narrow; share price, not size, sets influence |
| Nasdaq Composite | All eligible Nasdaq-listed securities; changes daily | Nasdaq-listed US and foreign companies | Market cap (total shares) | Tech-heavy; largest names dominate |
| Nasdaq-100 | About 100 | Large Nasdaq non-financials | Modified market cap | No financials; concentrated |
| Russell 2000 | About 2,000; varies | US small-cap | Float-adjusted market cap | Excludes large companies |
Canada’s Major Stock Market Indices
The S&P/TSX Composite is Canada’s principal broad equity benchmark, with a little over 200 companies. Under the S&P/TSX methodology, a company must be Canadian-domiciled or incorporated, listed on the TSX for at least six full months, and pass size and liquidity tests. Weights are float-adjusted market capitalization. As of October 12, 2026, the iShares Core S&P/TSX Capped Composite ETF (XIC), which tracks the capped version of the Composite, held roughly 33% financials, 18% materials and 17% energy, about 68% in three sectors. Technology was near 9%. That mix reflects who is listed in Toronto: banks, insurers, miners, pipelines and producers. Governments, healthcare systems and most private businesses, which are a large part of the economy, don’t appear in the index at all. It measures Canada’s listed companies, not Canada.
The S&P/TSX 60 is a 60-company large-cap subset of the Composite. The committee selects with a view to sector balance, so it isn’t strictly the 60 largest. You mostly meet it through ETFs such as XIU, which track the TSX 60 rather than the broader Composite.
The S&P/TSX SmallCap Index measures smaller Canadian listed companies, float-adjusted and cap-weighted, and S&P describes it as a separate index from the Composite family. It isn’t the TSX Venture Exchange, a separate marketplace for junior issuers. One is a measurement, the other a place where shares trade.
| Index | Coverage | Principal use |
|---|---|---|
| S&P/TSX Composite | Broad Canadian listed market, a little over 200 companies | Main benchmark for Canadian equities |
| S&P/TSX 60 | 60 large companies, sector-balanced | Large-cap benchmark; basis for ETFs such as XIU |
| S&P/TSX SmallCap | Smaller Canadian listed companies | Benchmark for small-cap exposure |
Why Different Indices Produce Different Returns
Index returns depend on four things beyond the market’s direction: which companies are inside, how they’re weighted, how sectors line up and which currency you measure in.
Start with composition. On October 12, 2026, the SPDR S&P 500 ETF’s holdings page showed information technology at about 39% of the portfolio and the ten largest positions at about 39%. The TSX leans on financials, materials and energy. So a technology rally flatters the S&P 500 and Nasdaq-100 far more than the TSX, while a commodity rally or strong bank earnings flatters the TSX. These weights are snapshots. Prices and committees keep changing them, so treat sector exposure as a current description, not a permanent trait.
Weighting matters as much. Market-cap weighting gives each company influence in proportion to its total value. Float-adjusted weighting counts only shares available to public investors. Price weighting uses share prices. Equal weighting gives every company the same slice, and modified market-cap weighting caps the largest weights. Here’s a three-stock index where the weighting alone decides the result.
| Stock | Price (USD) | Shares (millions) | Starting market cap (USD millions) | Return |
|---|---|---|---|---|
| A | 50 | 4,000 | 200,000 | +20% |
| B | 200 | 300 | 60,000 | -10% |
| C | 100 | 400 | 40,000 | -10% |
Weighted by market cap, A is 66.7% of the index and the index rises 10.0%. Weighted equally, it’s flat at 0.0%. Weighted by price, B is 57.1% of the index and the index falls 5.7%. The same three stocks give three different answers, and no single answer is wrong. They answer different questions.
Currency changes the answer again. Suppose a US index rises 10% in US dollars while the Canadian dollar strengthens from 1.40 to 1.33 per US dollar. Your unhedged return in Canadian dollars is 1.10 x (1.33 / 1.40) – 1, or 4.5%. If the Canadian dollar weakens to 1.47 instead, the same index returns 15.5%. Currency exposure comes from the assets, not from where the fund is listed. A CAD-listed ETF can carry full US-dollar exposure, and a USD-listed one can be hedged.
Why the Index Can Rise While Most Stocks Fall
The table above already shows it. Two of three stocks fell, yet the market-cap-weighted index rose 10%, because the one winner was two-thirds of the index. Real indices behave the same way, with less drama. Market breadth, the share of stocks participating in a move, can diverge sharply from the headline number.
The S&P 500 is the clearest example. The ten largest positions were about 39% of the SPDR S&P 500 ETF on October 12, 2026. In the S&P 500 Equal Weight Index, which gives each company 0.2% at every quarterly rebalance, the same ten would be 2%. If a handful of mega-cap technology companies climb while hundreds of others drift, the cap-weighted index rises and the equal-weighted version lags. The two aren’t measuring different markets. They’re asking how much each company should matter.
Narrow leadership doesn’t forecast a decline. Leadership can persist for years or fade, and nobody knows which. The point is narrower: “the index is up” and “most stocks are up” are different statements, and the first doesn’t establish the second.
Price Returns, Total Returns and Dividends
A price return counts only changes in share prices. A total return adds dividends, assuming they’re reinvested. S&P Dow Jones Indices publishes price return, gross total return (dividends reinvested on the ex-date, before withholding tax) and, where available, net total return (reinvested after withholding taxes). Take a stock yielding 4% with a flat price: its price return is zero and its total return is roughly 4% a year.
This matters for Canadians because the TSX is full of dividend payers: banks, pipelines, telecoms and utilities. I covered the banks in Canadian bank stocks and the income-heavy sector in Canadian utility stocks. Compare a price-only TSX chart with a total-return S&P 500 chart and you’ve understated the TSX and flattered the American market.
Index total returns also aren’t your returns. They ignore fund fees and your tax rate, and they either leave out foreign withholding tax or assume a rate for it: Vanguard benchmarks its S&P 500 ETF against a net total return index that assumes 15% withholding, which is the index provider’s assumption, not necessarily what the fund bears or what you pay. How dividends are taxed is a separate subject, covered in dividend tax treatment in Canada.
What Are You Actually Buying When You Buy an Index ETF?
An index ETF aims to track a benchmark, subject to fees, tracking difference and structure. Similar names can hide different indices, so read the benchmark. As of October 2026, XIC tracks the S&P/TSX Capped Composite, which caps any company at 10%, at a 0.06% MER. XIU tracks the S&P/TSX 60 at 0.17%. Vanguard’s VFV targets the S&P 500 with a low management expense ratio and gets there by holding a US-listed Vanguard fund. A CAD-listed Nasdaq-100 fund such as QQC follows the Nasdaq-100 Index in Canadian dollars, while iShares’ XQQ follows a currency-hedged version of it.
Currency separates funds that look alike. VFV trades in Canadian dollars but isn’t CAD-hedged, so you keep the US-dollar exposure. Vanguard sells a separate CAD-hedged version, VSP, which uses derivatives to seek to hedge it away. A US-listed fund on the same index trades in US dollars, so you convert the money yourself, and fees, tracking and tax treatment differ. The registered-account side is a tax question, and my TFSA deep dive and ETFs vs mutual funds vs individual stocks cover it. Funds don’t replicate their benchmarks perfectly, because fees and implementation always cost something.
Index Overlap
Holding an S&P 500 ETF next to a Nasdaq-100 ETF doesn’t deliver much extra diversification. The largest names in the two indices are largely the same companies, including Nvidia, Apple, Microsoft, Amazon, Alphabet and Meta. The second fund mostly increases your exposure to companies you already own. Canada works the same way: the TSX 60 is a subset of the Composite, so pairing XIC with XIU buys the large companies twice. Different fund names don’t create different exposure.
A Brief Look at Global Stock Market Indices
Indices come at several scales. Country indices include the FTSE 100 (the 100 largest companies on the London Stock Exchange), the Nikkei 225, TOPIX and the Hang Seng Index, which tracks major Hong Kong-listed companies. The EURO STOXX 50 is regional, tracking 50 large eurozone companies by free-float value with a 10% cap on each. The Nikkei 225 is price-weighted across 225 Tokyo Prime Market stocks, while TOPIX uses float-adjusted market-cap weighting, so Japan’s two headline indices can tell different stories. I look at that in investing in Japan.
At the global level, MSCI World covers 23 developed markets, including Canada, and no emerging markets. At September 30, 2026 it had 1,249 constituents. MSCI ACWI adds 24 emerging markets to the same 23 developed ones and had 2,414 constituents. FTSE All-World also spans developed and emerging markets. Whether to buy these markets directly is the question Article 4 takes up.
Which Index Should Canadian Investors Follow?
No index is the right one, because each answers a different question. The S&P 500 asks how major US companies are doing. The Nasdaq-100 asks about large non-financial Nasdaq-listed companies. The Russell 2000 covers smaller US companies, the S&P/TSX Composite the major Canadian listed companies, and MSCI ACWI developed and emerging markets together. Watching several gives a fuller picture than watching the Dow alone.
Your benchmark should match what you own. A Canadian holding a globally diversified portfolio shouldn’t judge it against the S&P 500, any more than a TSX-heavy investor should judge it against the Nasdaq-100. Beating the wrong yardstick tells you nothing.
An Index Is a Measurement, Not the Market
Stock market indices are constructed measurements of selected securities. They’re not complete descriptions of an economy or an investment opportunity. Their returns reflect which companies they include, how those companies are weighted, and the currency and return method used. Know those choices and a headline becomes information, and an index fund becomes something you understand rather than something you merely own. The next article in the series turns to securities that trade away from the major exchanges: OTC stocks, ADRs and Pink Sheets.
Disclaimer: This article is for general informational and educational purposes only and does not constitute personalized financial, investment, tax or legal advice. Investors should conduct their own research and consult qualified professionals where appropriate.